 4
4peptides
spectra
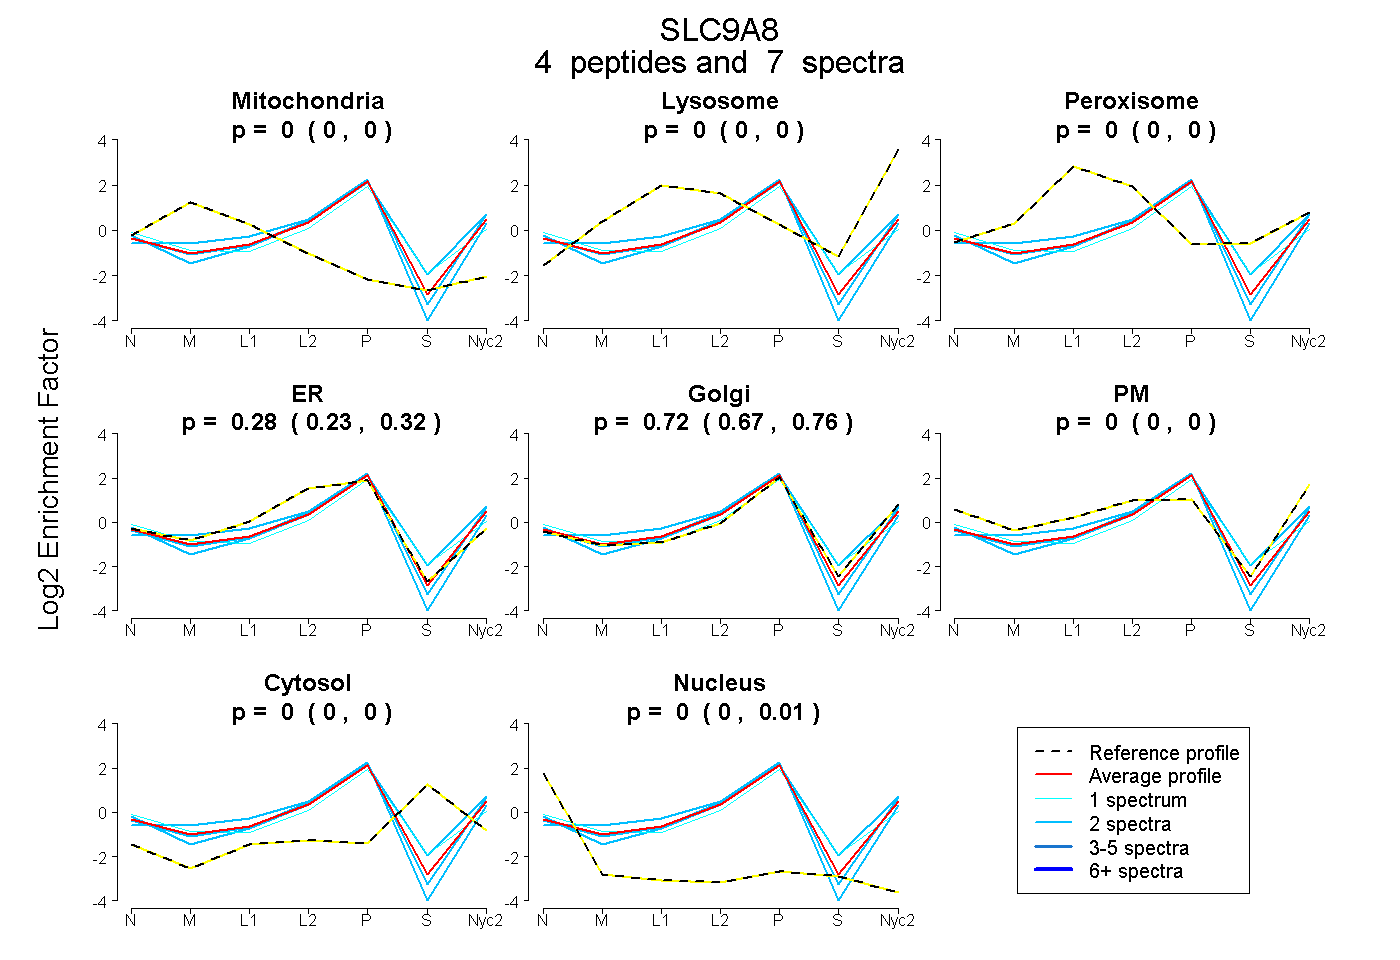
0.000 | 0.000
0.000 | 0.000
0.000 | 0.000
0.235 | 0.316
0.673 | 0.756
0.000 | 0.004
0.000 | 0.000
0.000 | 0.007
| Plot | Mito | Lyso | Perox | ER | Golgi | PM | Cytosol | Nucleus | |||||
| Expt A |
4 peptides |
7 spectra |
|
0.000 0.000 | 0.000 |
0.000 0.000 | 0.000 |
0.000 0.000 | 0.000 |
0.278 0.235 | 0.316 |
0.722 0.673 | 0.756 |
0.000 0.000 | 0.004 |
0.000 0.000 | 0.000 |
0.000 0.000 | 0.007 |
| 1 spectrum, WYEEVR | 0.000 | 0.000 | 0.000 | 0.234 | 0.664 | 0.000 | 0.067 | 0.034 | ||
| 2 spectra, YLNPFFTR | 0.000 | 0.000 | 0.000 | 0.270 | 0.730 | 0.000 | 0.000 | 0.000 | ||
| 2 spectra, LVDIEDAR | 0.000 | 0.000 | 0.000 | 0.167 | 0.755 | 0.026 | 0.052 | 0.000 | ||
| 2 spectra, GFMWLDAK | 0.009 | 0.000 | 0.000 | 0.497 | 0.494 | 0.000 | 0.000 | 0.000 |
| Plot | Mito | Lyso or Perox | ER | Golgi | PM | Cytosol | Nucleus | ||||||
| Expt B |
1 peptide |
2 spectra |
 |
0.000 NA | NA |
0.000 NA | NA |
0.767 NA | NA |
0.233 NA | NA |
0.000 NA | NA |
0.000 NA | NA |
0.000 NA | NA |
|||
| Plot | Lyso | Other | |||||||||||
| Expt C |
5 peptides |
15 spectra |
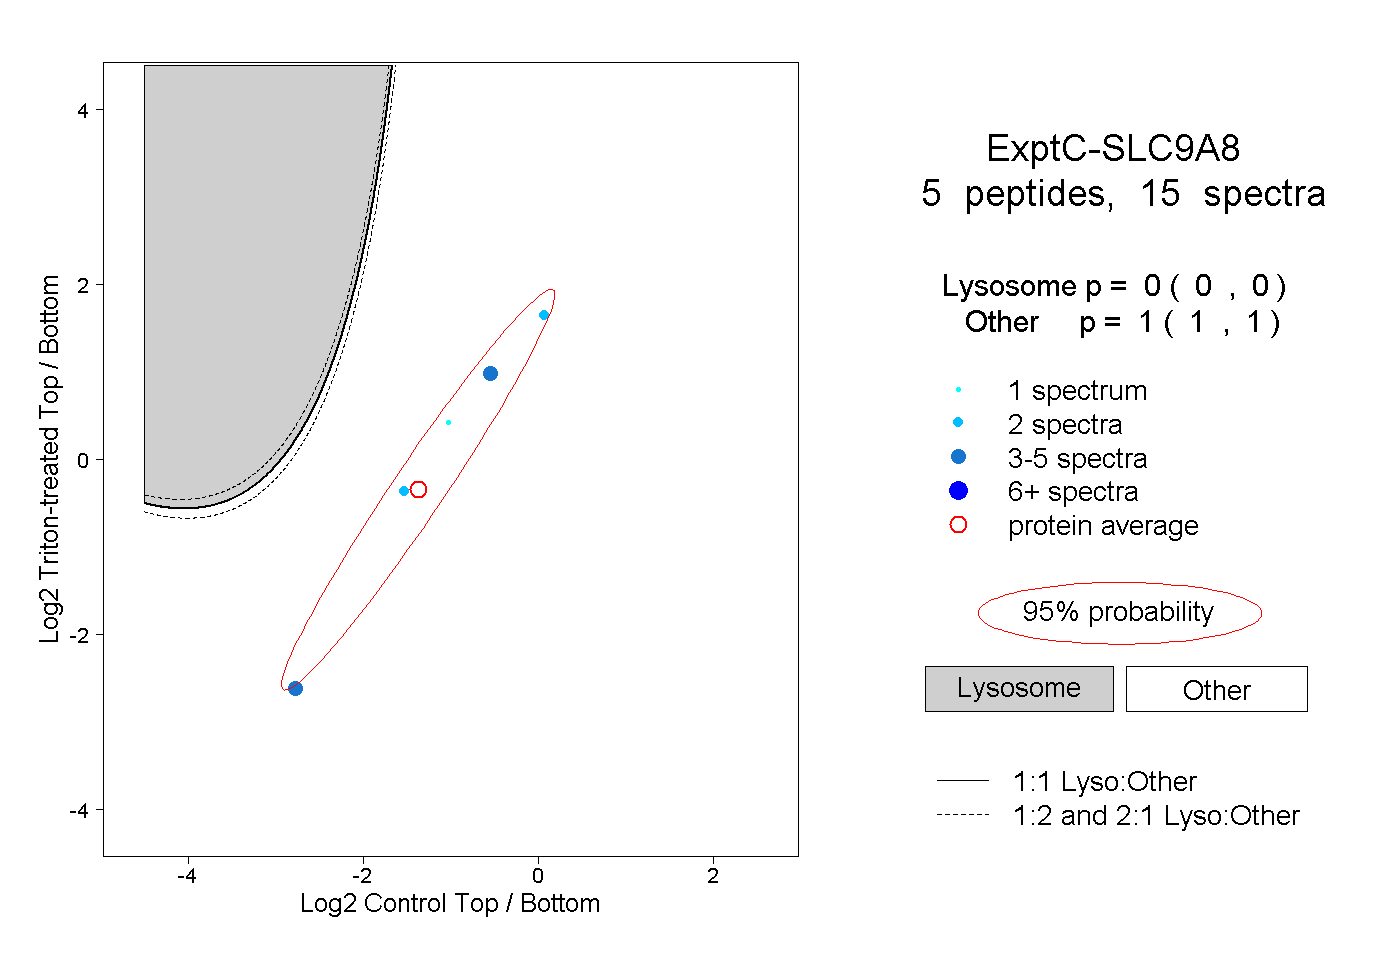 |
0.000 0.000 | 0.000 |
1.000 1.000 | 1.000 |