 12
12peptides
spectra
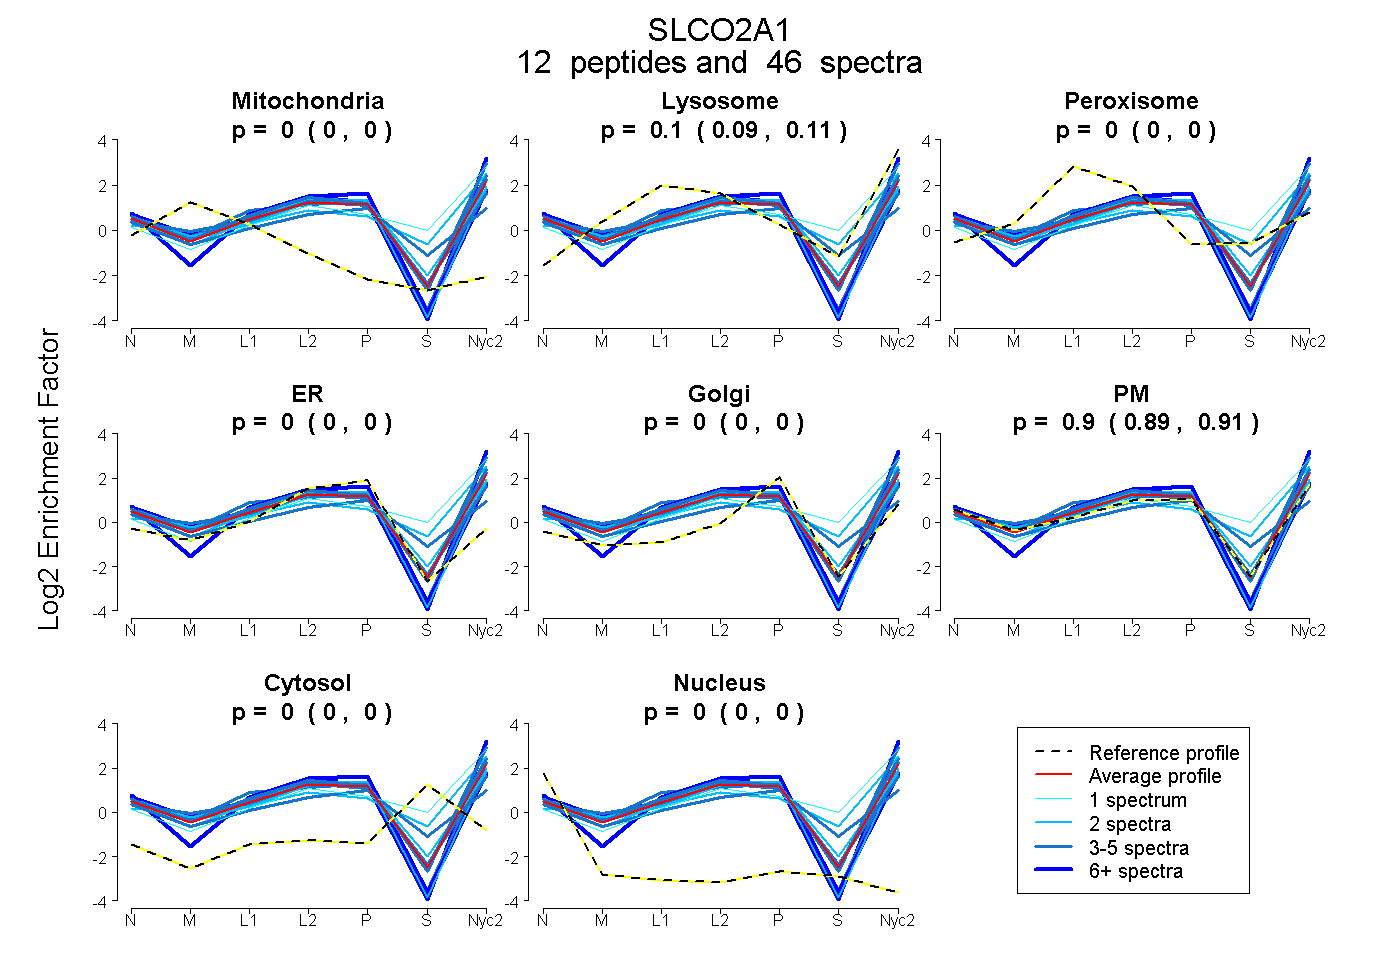
0.000 | 0.000
0.087 | 0.109
0.000 | 0.000
0.000 | 0.000
0.000 | 0.000
0.888 | 0.911
0.000 | 0.000
0.000 | 0.000
| Plot | Mito | Lyso | Perox | ER | Golgi | PM | Cytosol | Nucleus | |||||
| Expt A |
12 peptides |
46 spectra |
|
0.000 0.000 | 0.000 |
0.099 0.087 | 0.109 |
0.000 0.000 | 0.000 |
0.000 0.000 | 0.000 |
0.000 0.000 | 0.000 |
0.901 0.888 | 0.911 |
0.000 0.000 | 0.000 |
0.000 0.000 | 0.000 |
| 2 spectra, IFVDYGR | 0.000 | 0.377 | 0.000 | 0.000 | 0.000 | 0.489 | 0.134 | 0.000 | ||
| 2 spectra, SVFSNIK | 0.000 | 0.071 | 0.000 | 0.034 | 0.000 | 0.895 | 0.000 | 0.000 | ||
| 9 spectra, GLLLKPGAR | 0.000 | 0.000 | 0.000 | 0.206 | 0.000 | 0.794 | 0.000 | 0.000 | ||
| 5 spectra, GSLMDFIK | 0.000 | 0.160 | 0.000 | 0.000 | 0.000 | 0.840 | 0.000 | 0.000 | ||
| 2 spectra, QGSGTSSVPDR | 0.000 | 0.000 | 0.000 | 0.031 | 0.000 | 0.969 | 0.000 | 0.000 | ||
| 4 spectra, WNYLCSGR | 0.000 | 0.077 | 0.034 | 0.090 | 0.000 | 0.798 | 0.000 | 0.000 | ||
| 1 spectrum, YLGLQMVYK | 0.000 | 0.426 | 0.000 | 0.000 | 0.000 | 0.371 | 0.203 | 0.000 | ||
| 5 spectra, VVNQDEK | 0.000 | 0.202 | 0.000 | 0.000 | 0.000 | 0.798 | 0.000 | 0.000 | ||
| 4 spectra, GACAYYDNDALR | 0.000 | 0.045 | 0.000 | 0.000 | 0.000 | 0.955 | 0.000 | 0.000 | ||
| 2 spectra, SSFQTDLCQK | 0.000 | 0.048 | 0.043 | 0.043 | 0.000 | 0.866 | 0.000 | 0.000 | ||
| 3 spectra, SVTAEETMK | 0.000 | 0.000 | 0.098 | 0.049 | 0.070 | 0.608 | 0.175 | 0.000 | ||
| 7 spectra, FVFPLQTIPR | 0.000 | 0.100 | 0.000 | 0.000 | 0.000 | 0.900 | 0.000 | 0.000 |
| Plot | Mito | Lyso or Perox | ER | Golgi | PM | Cytosol | Nucleus | ||||||
| Expt B |
4 peptides |
7 spectra |
 |
0.000 0.000 | 0.000 |
0.029 0.000 | 0.118 |
0.564 0.139 | 0.732 |
0.000 0.000 | 0.201 |
0.198 0.000 | 0.529 |
0.000 0.000 | 0.075 |
0.208 0.063 | 0.266 |
|||
| Plot | Lyso | Other | |||||||||||
| Expt C |
14 peptides |
86 spectra |
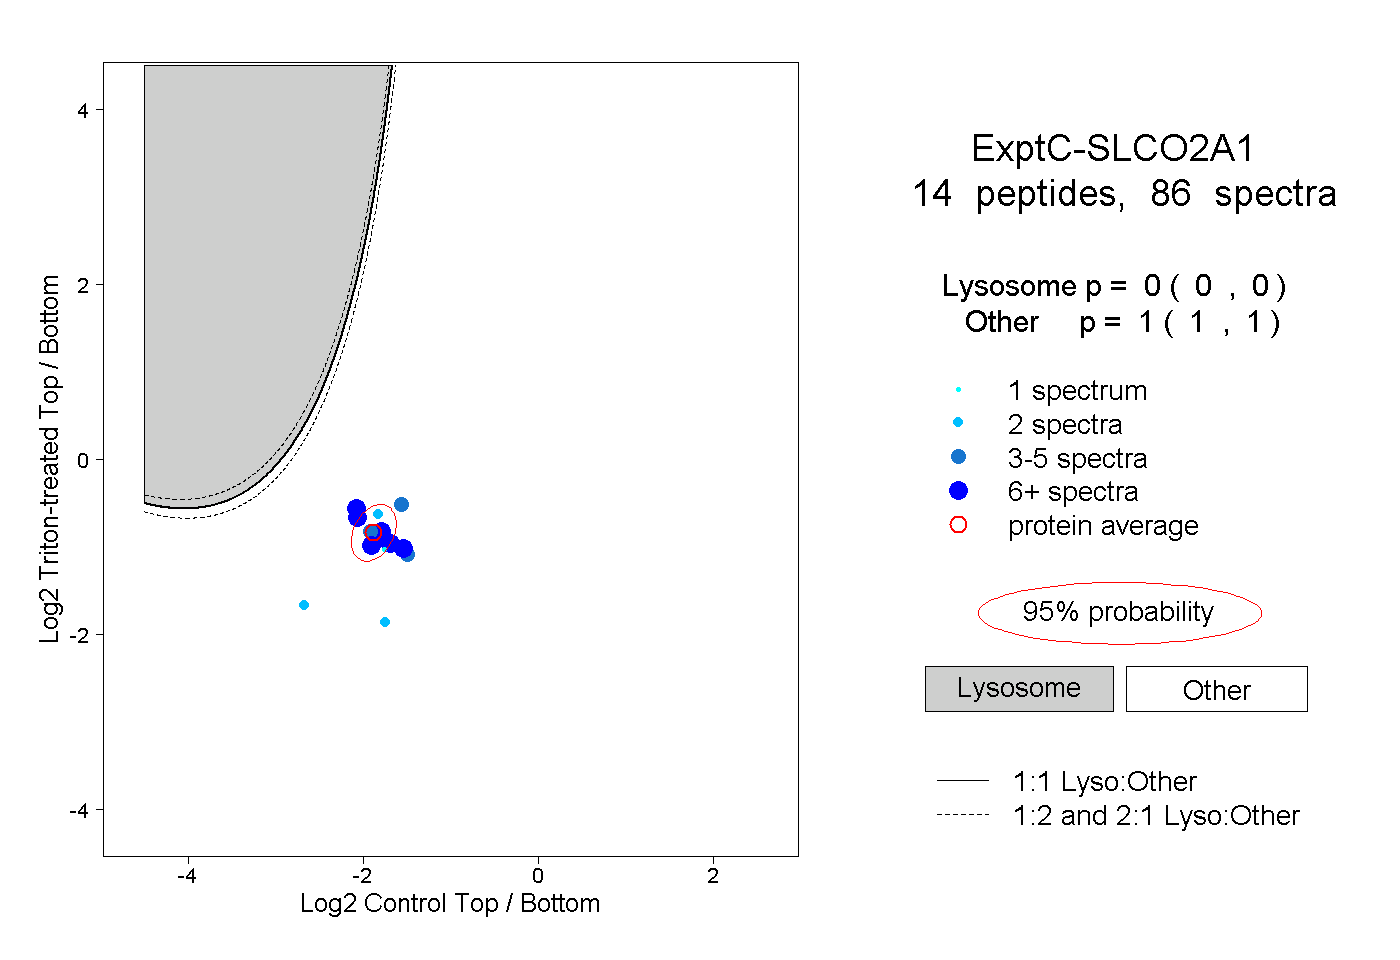 |
0.000 0.000 | 0.000 |
1.000 1.000 | 1.000 |
||||||||
| Plot | Lyso | Other | |||||||||||
| Expt D |
7 peptides |
11 spectra |
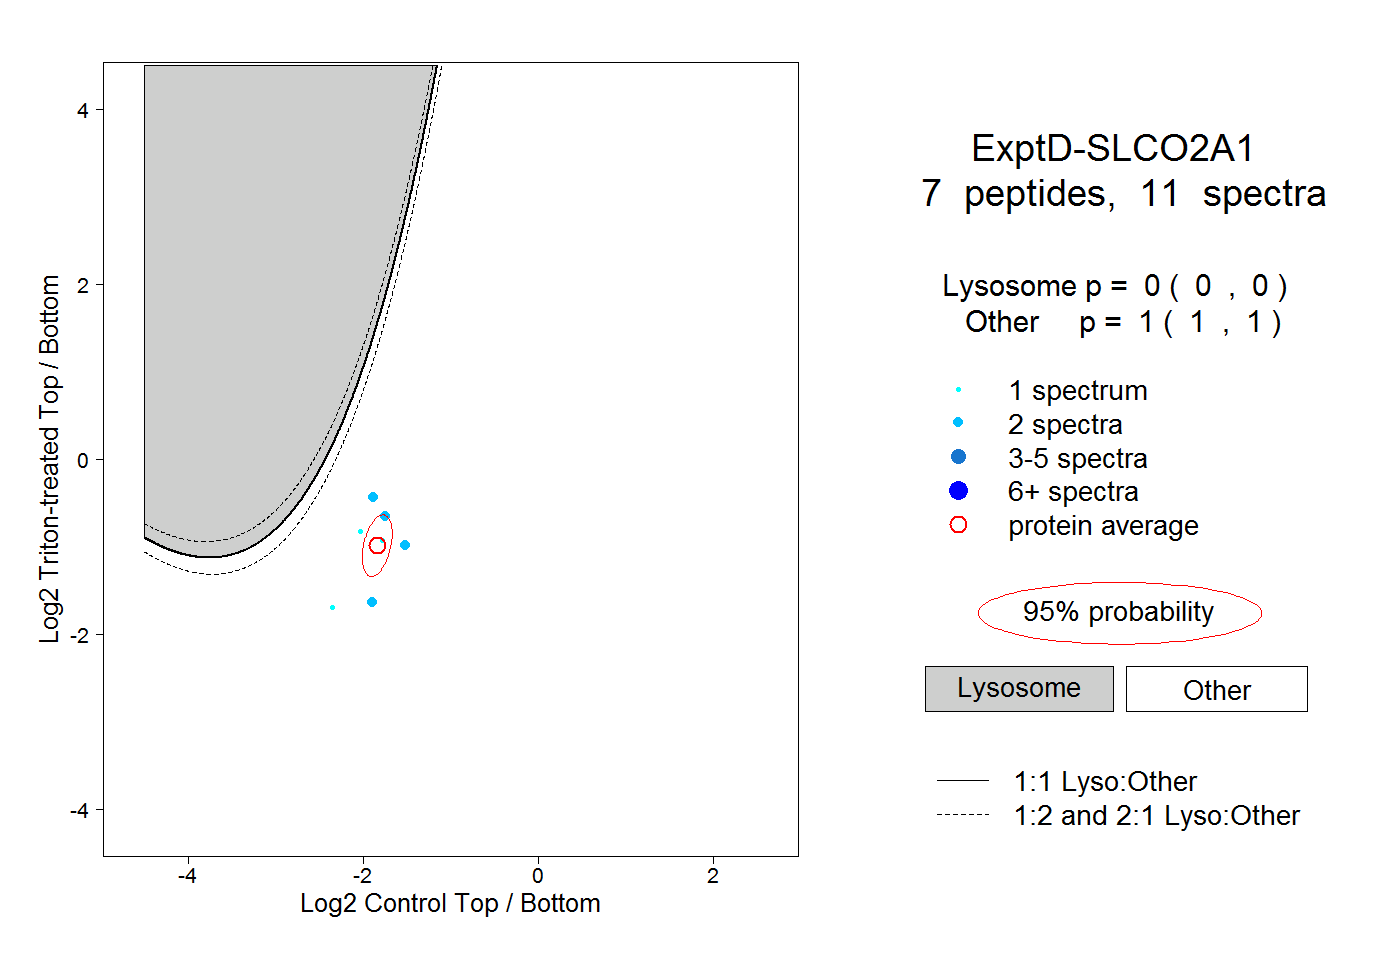 |
0.000 0.000 | 0.000 |
1.000 1.000 | 1.000 |