 2
2peptides
spectra
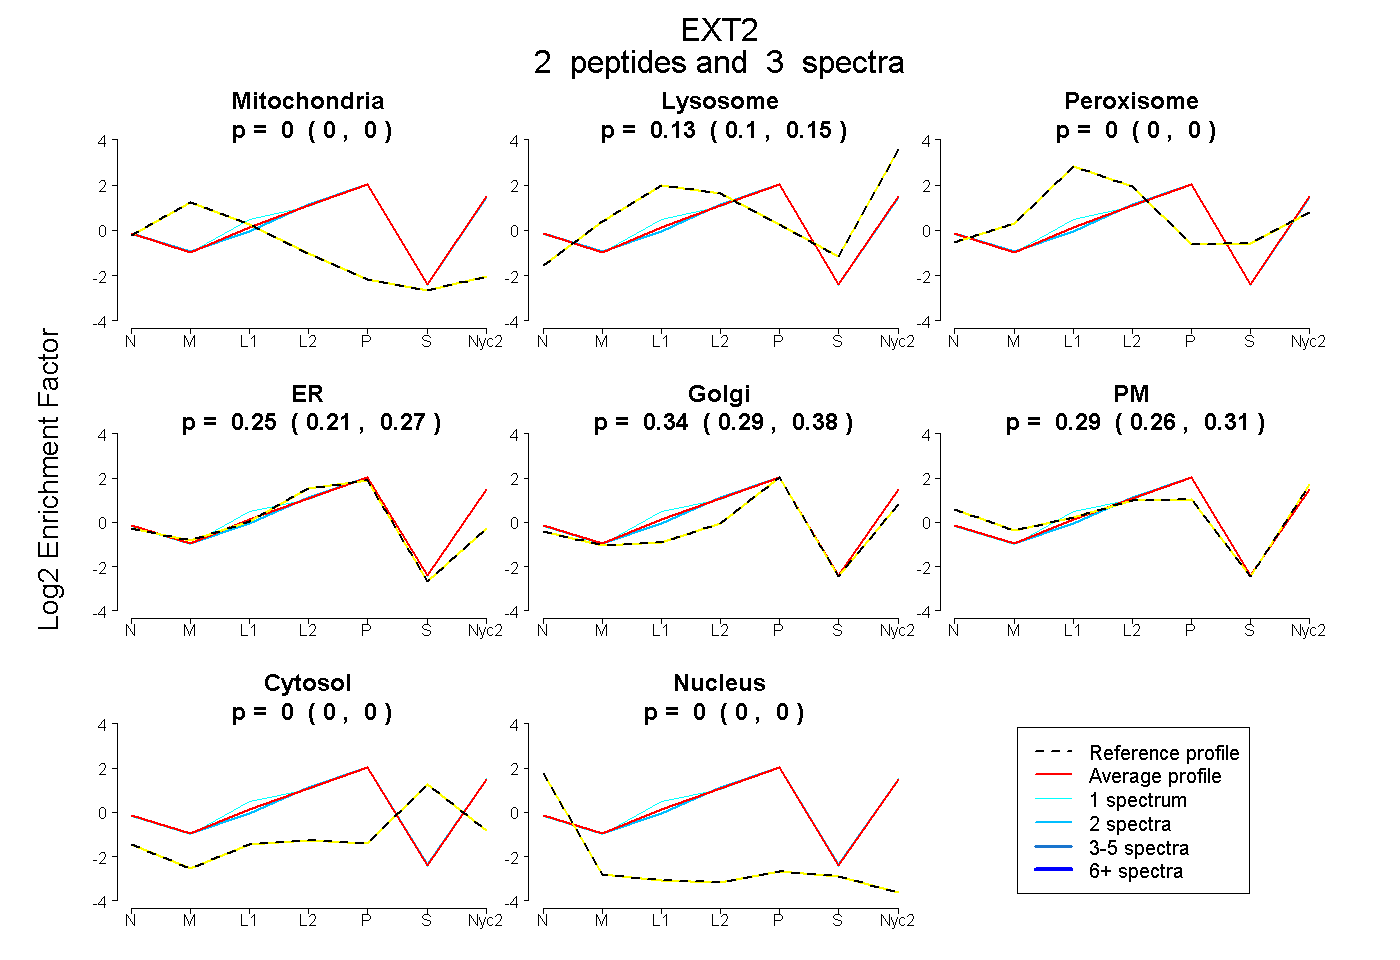
0.000 | 0.000
0.101 | 0.147
0.000 | 0.000
0.213 | 0.274
0.291 | 0.381
0.265 | 0.308
0.000 | 0.000
0.000 | 0.000
| Plot | Mito | Lyso | Perox | ER | Golgi | PM | Cytosol | Nucleus | |||||
| Expt A |
2 peptides |
3 spectra |
|
0.000 0.000 | 0.000 |
0.127 0.101 | 0.147 |
0.000 0.000 | 0.000 |
0.246 0.213 | 0.274 |
0.340 0.291 | 0.381 |
0.287 0.265 | 0.308 |
0.000 0.000 | 0.000 |
0.000 0.000 | 0.000 |
| 1 spectrum, YVDDAGVPVSSAISR | 0.000 | 0.163 | 0.000 | 0.278 | 0.287 | 0.273 | 0.000 | 0.000 | ||
| 2 spectra, LTADSPIPER | 0.000 | 0.109 | 0.000 | 0.230 | 0.367 | 0.294 | 0.000 | 0.000 |
| Plot | Lyso | Other | |||||||||||
| Expt C |
5 peptides |
9 spectra |
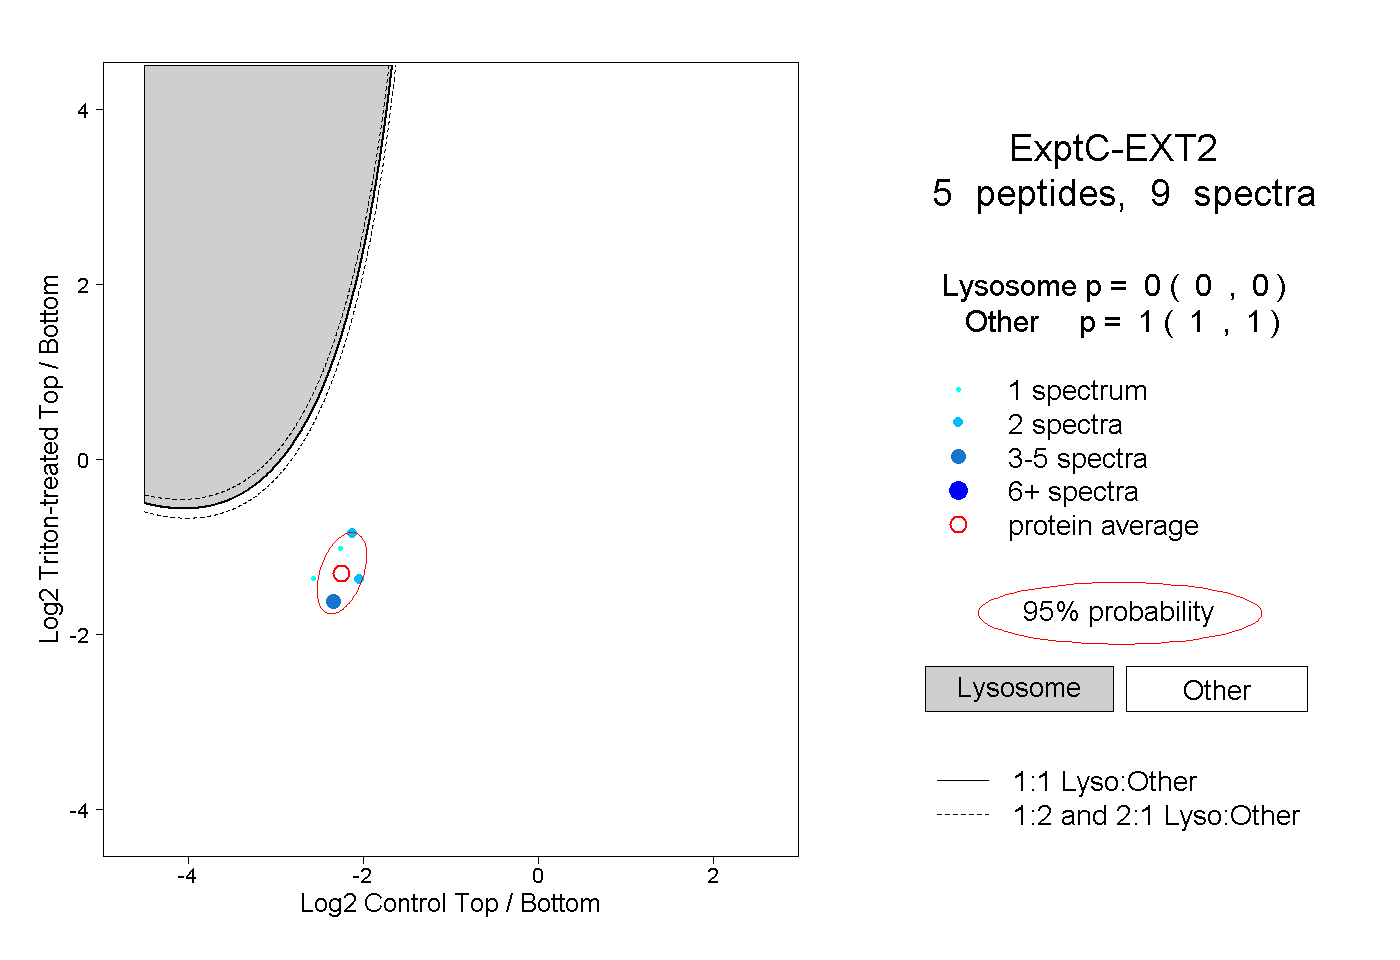 |
0.000 0.000 | 0.000 |
1.000 1.000 | 1.000 |