 3
3peptides
spectra
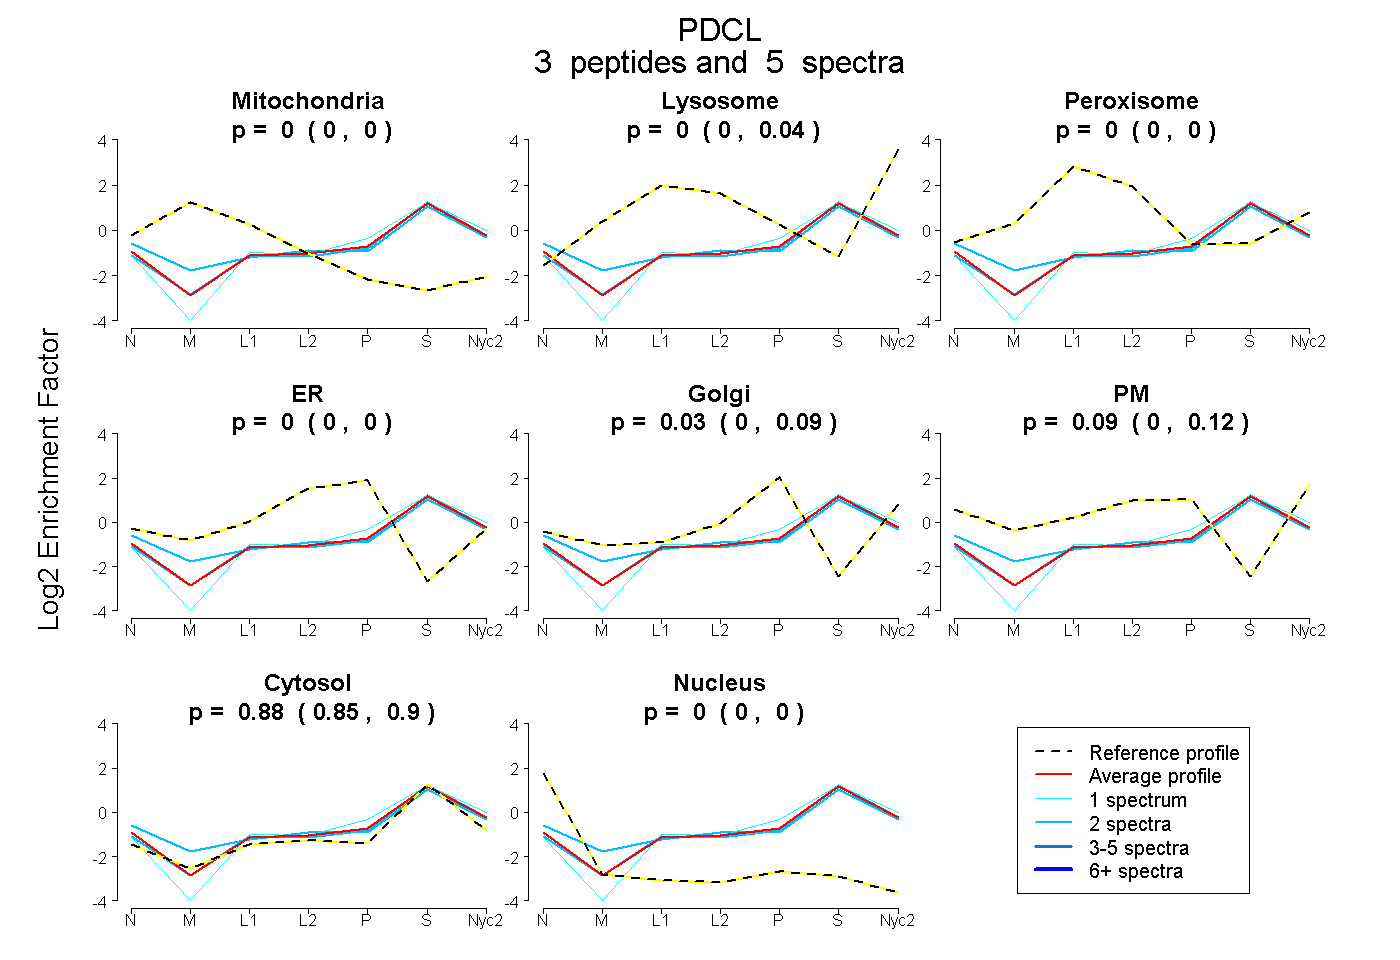
0.000 | 0.000
0.000 | 0.041
0.000 | 0.000
0.000 | 0.000
0.000 | 0.092
0.000 | 0.125
0.846 | 0.904
0.000 | 0.000
| Plot | Mito | Lyso | Perox | ER | Golgi | PM | Cytosol | Nucleus | |||||
| Expt A |
3 peptides |
5 spectra |
|
0.000 0.000 | 0.000 |
0.003 0.000 | 0.041 |
0.000 0.000 | 0.000 |
0.000 0.000 | 0.000 |
0.028 0.000 | 0.092 |
0.089 0.000 | 0.125 |
0.880 0.846 | 0.904 |
0.000 0.000 | 0.000 |
| 2 spectra, NLDDEEFLQQYR | 0.000 | 0.000 | 0.022 | 0.000 | 0.000 | 0.166 | 0.812 | 0.000 | ||
| 1 spectrum, SSVIGASSR | 0.000 | 0.000 | 0.000 | 0.000 | 0.113 | 0.000 | 0.887 | 0.000 | ||
| 2 spectra, AGELIGNFVR | 0.000 | 0.041 | 0.000 | 0.000 | 0.049 | 0.010 | 0.901 | 0.000 |
| Plot | Mito | Lyso or Perox | ER | Golgi | PM | Cytosol | Nucleus | ||||||
| Expt B |
1 peptide |
1 spectrum |
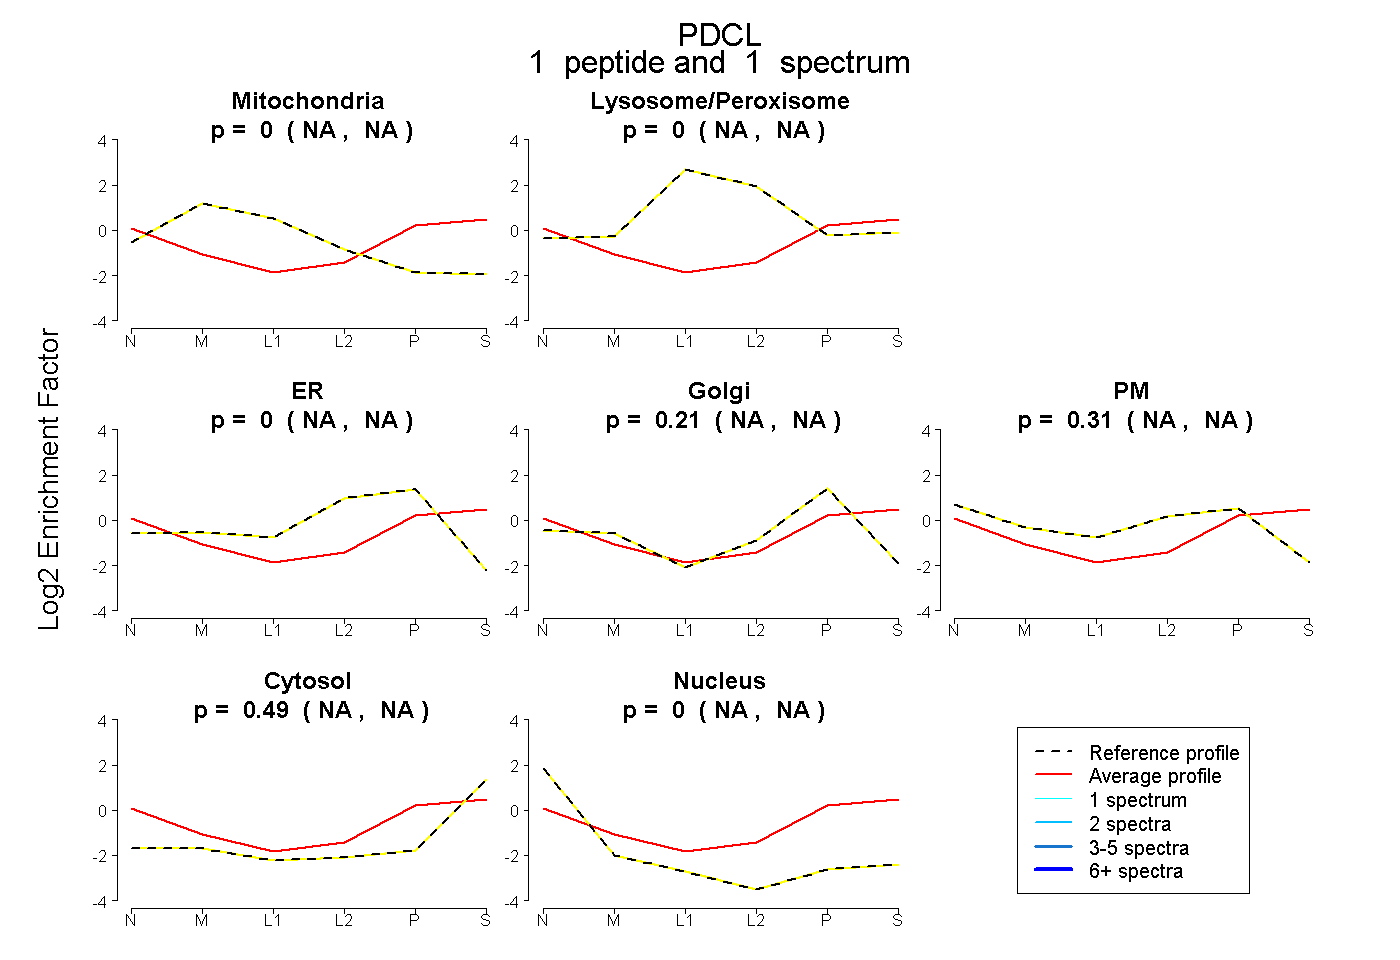 |
0.000 NA | NA |
0.000 NA | NA |
0.000 NA | NA |
0.205 NA | NA |
0.309 NA | NA |
0.486 NA | NA |
0.000 NA | NA |
|||
| Plot | Lyso | Other | |||||||||||
| Expt C |
1 peptide |
1 spectrum |
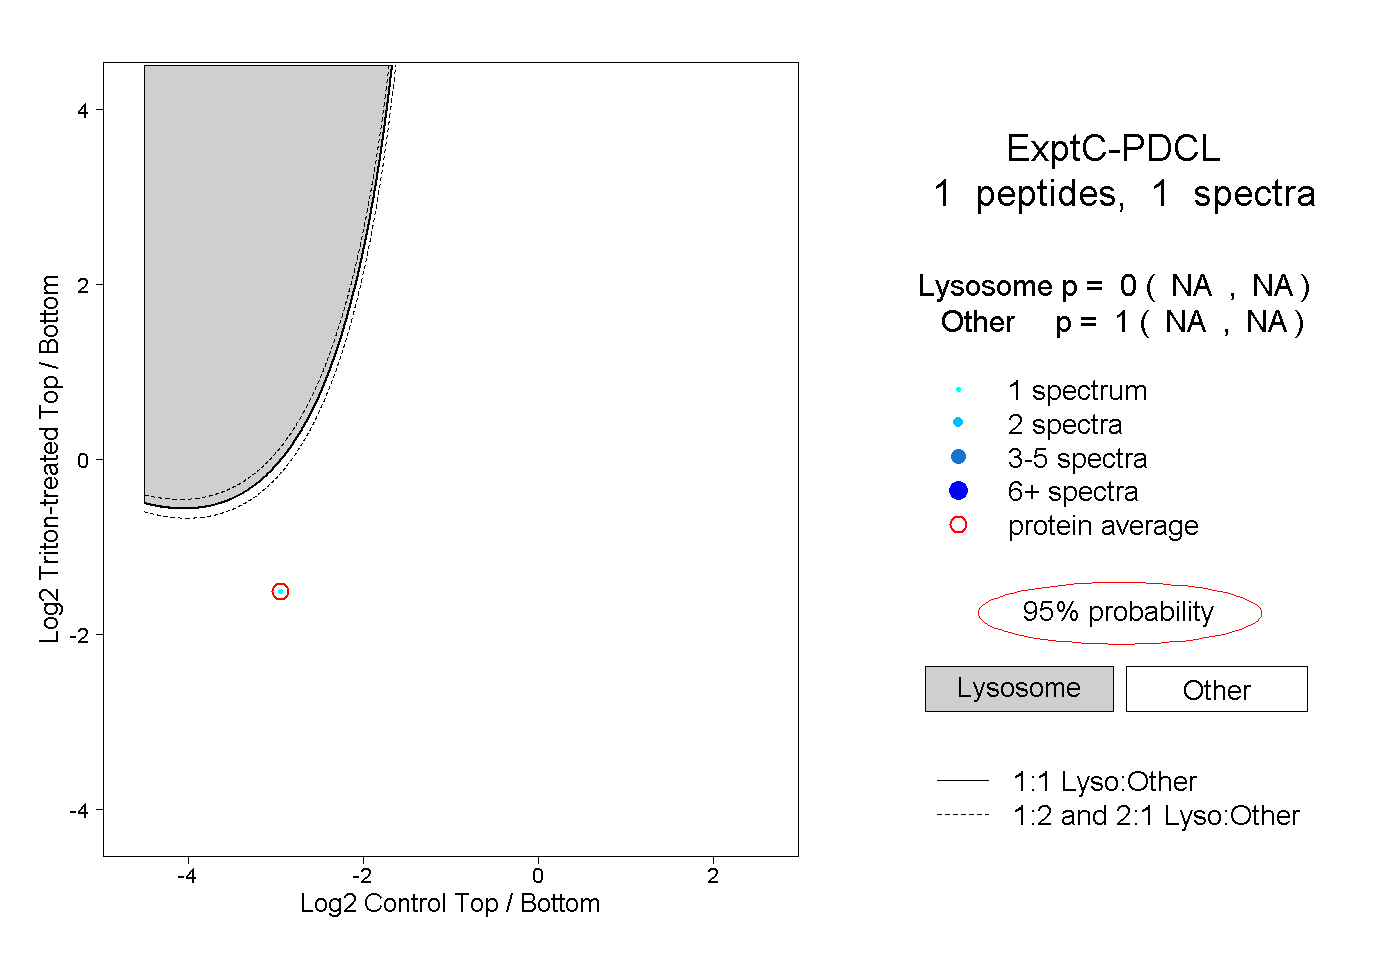 |
0.000 NA | NA |
1.000 NA | NA |