 2
2peptides
spectra
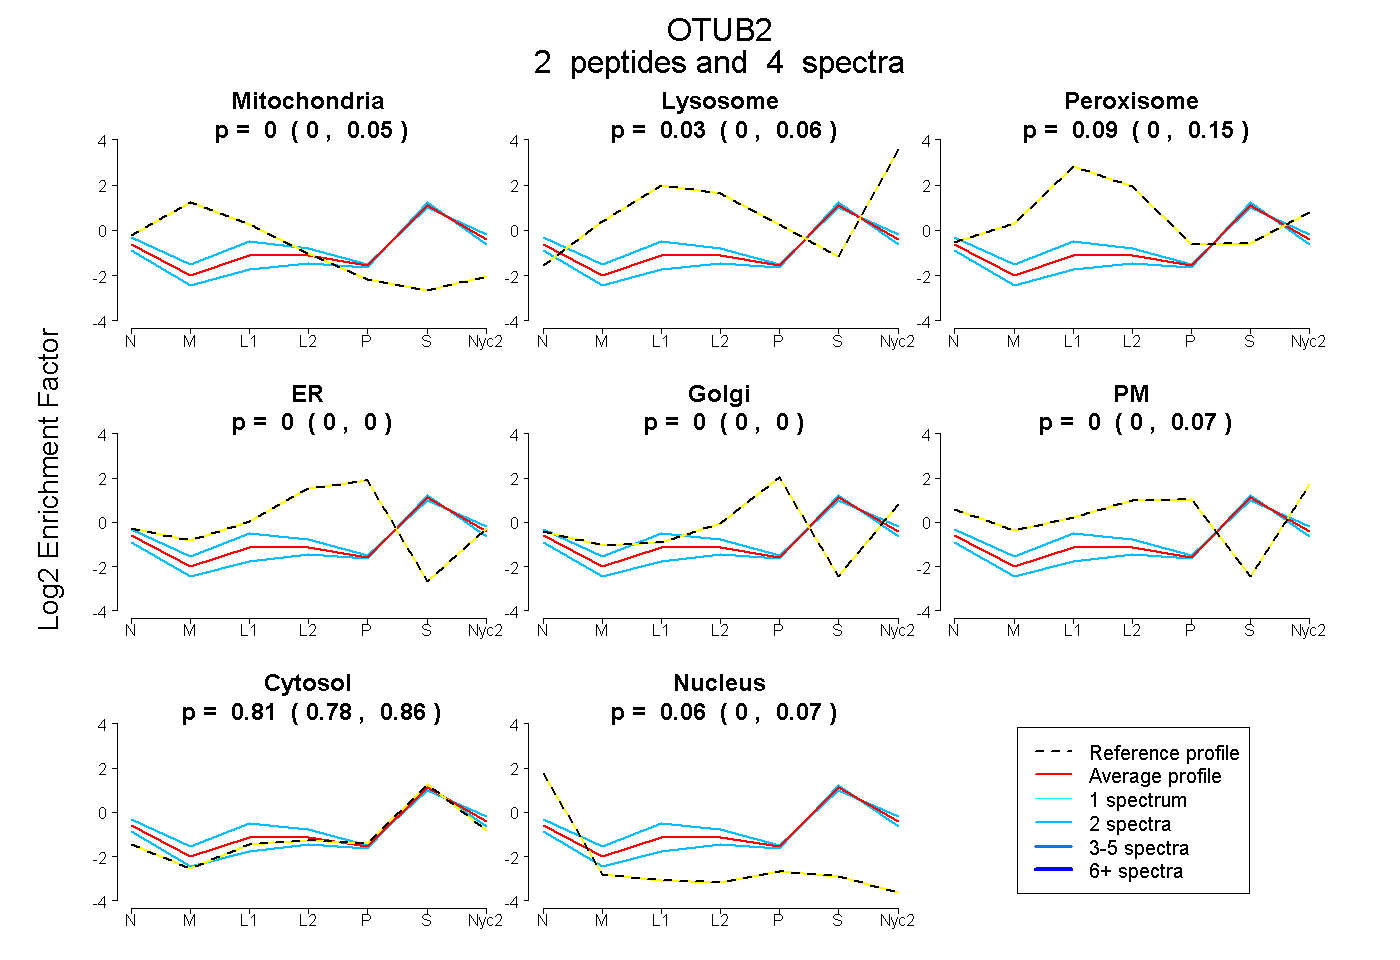
0.000 | 0.052
0.000 | 0.065
0.000 | 0.155
0.000 | 0.000
0.000 | 0.000
0.000 | 0.065
0.778 | 0.859
0.001 | 0.071
2peptides
spectra
0.000 | 0.000
1.000 | 1.000
| Plot | Mito | Lyso | Perox | ER | Golgi | PM | Cytosol | Nucleus | |||||
| Expt A |
2 peptides |
4 spectra |
|
0.000 0.000 | 0.052 |
0.027 0.000 | 0.065 |
0.095 0.000 | 0.155 |
0.000 0.000 | 0.000 |
0.000 0.000 | 0.000 |
0.004 0.000 | 0.065 |
0.815 0.778 | 0.859 |
0.059 0.001 | 0.071 |
||
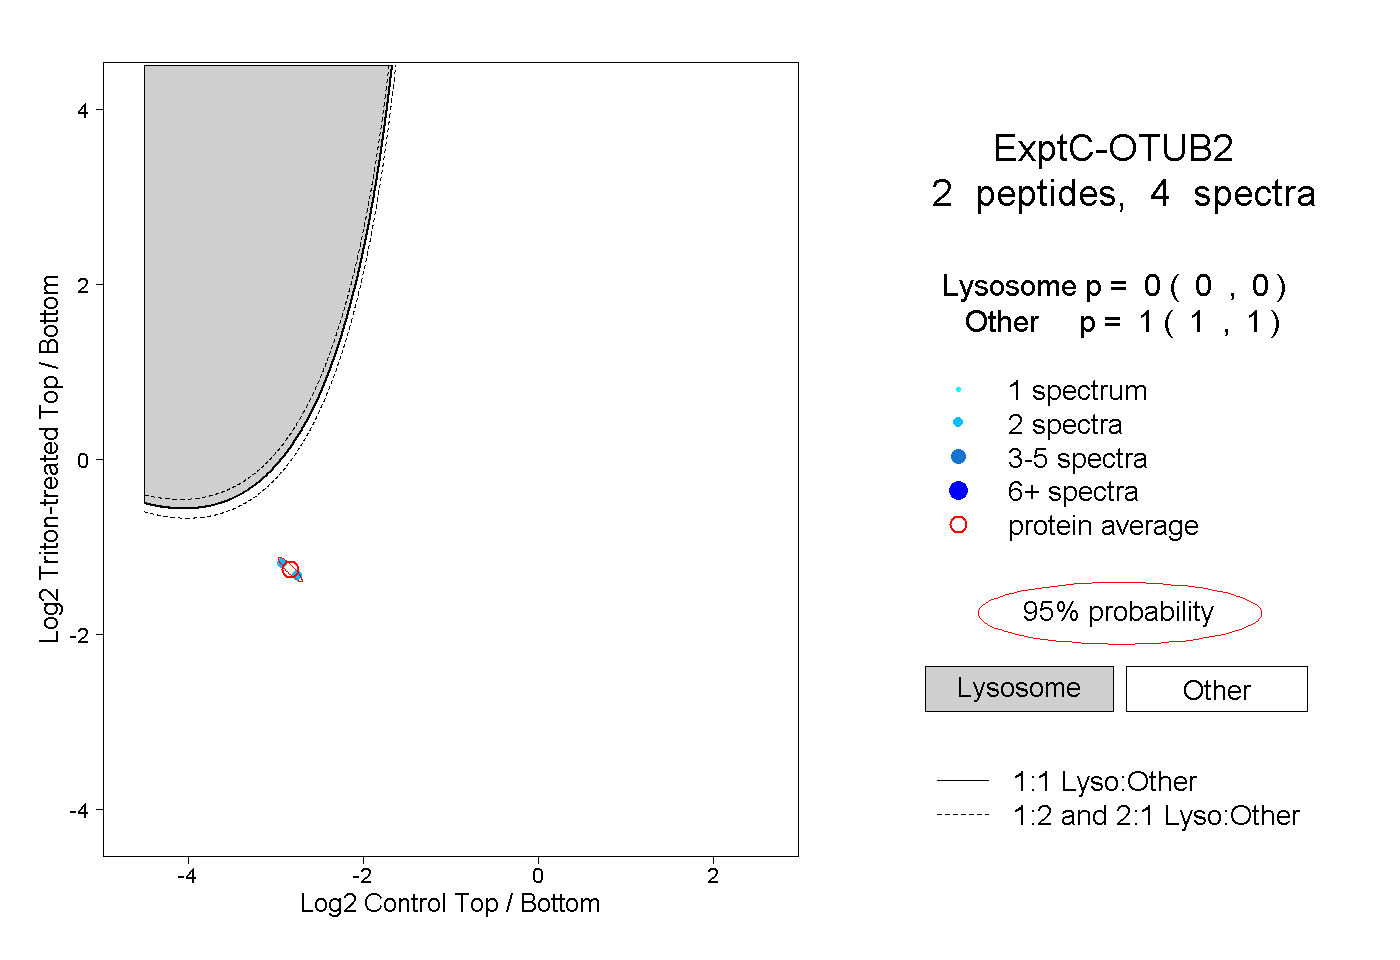
| Plot | Lyso | Other | |||||||||||
| Expt C |
2 peptides |
4 spectra |
|
0.000 0.000 | 0.000 |
1.000 1.000 | 1.000 |