 7
7peptides
spectra
0.000 | 0.000
0.806 | 0.819
0.000 | 0.000
0.000 | 0.000
0.000 | 0.000
0.000 | 0.000
0.180 | 0.193
0.000 | 0.000
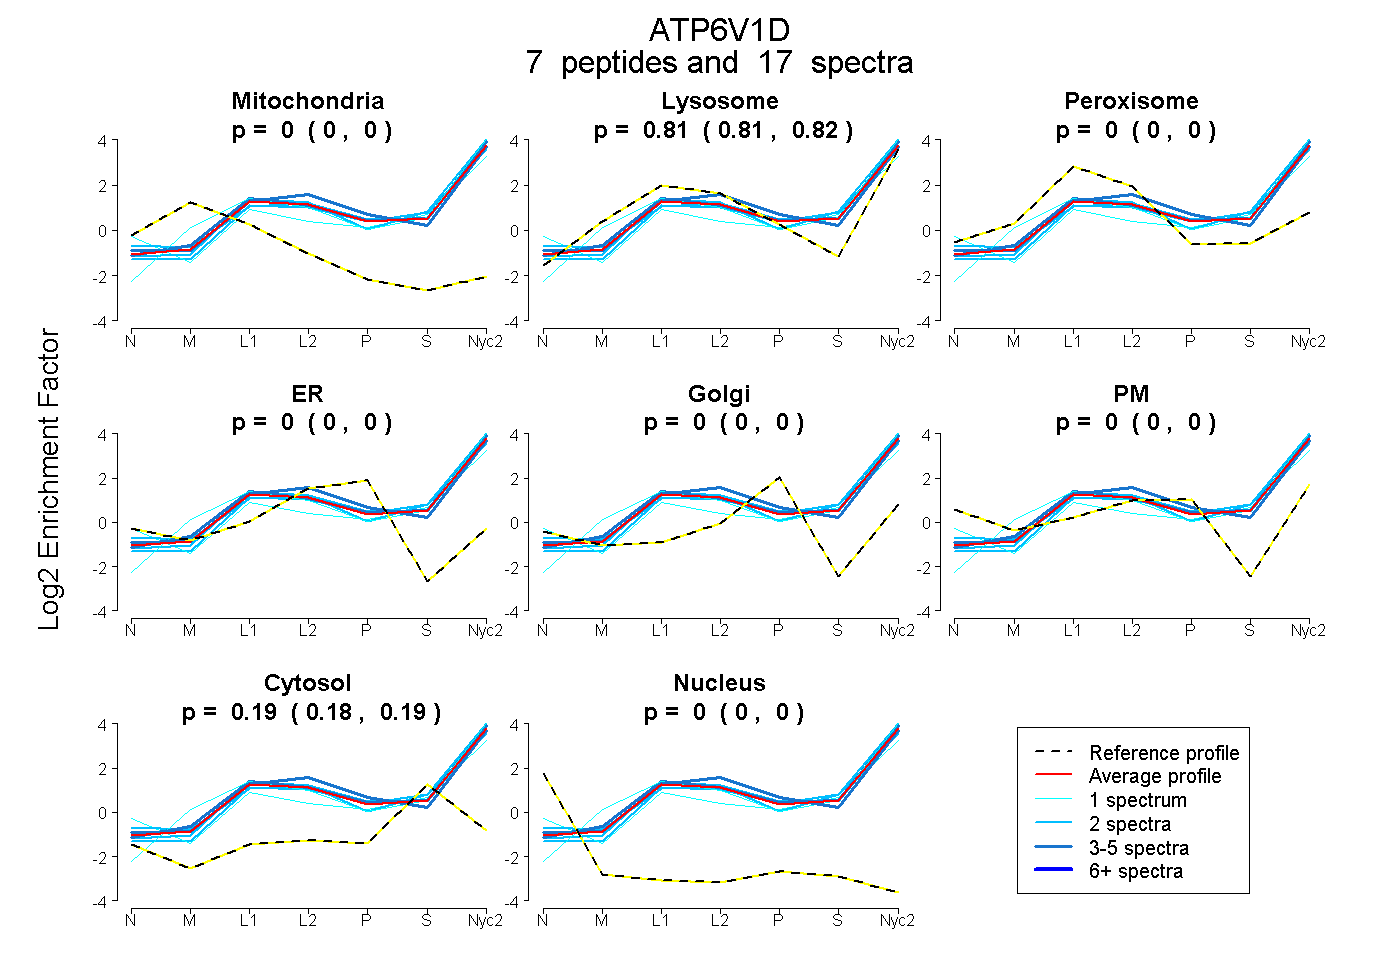
| Plot | Mito | Lyso | Perox | ER | Golgi | PM | Cytosol | Nucleus | |||||
| Expt A |
7 peptides |
17 spectra |
|
0.000 0.000 | 0.000 |
0.813 0.806 | 0.819 |
0.000 0.000 | 0.000 |
0.000 0.000 | 0.000 |
0.000 0.000 | 0.000 |
0.000 0.000 | 0.000 |
0.187 0.180 | 0.193 |
0.000 0.000 | 0.000 |
| 5 spectra, VNAIEHVIIPR | 0.000 | 0.851 | 0.000 | 0.000 | 0.000 | 0.000 | 0.149 | 0.000 | ||
| 1 spectrum, GGEQLAK | 0.000 | 0.663 | 0.000 | 0.000 | 0.000 | 0.009 | 0.328 | 0.000 | ||
| 1 spectrum, TLAYIITELDER | 0.000 | 0.876 | 0.000 | 0.000 | 0.000 | 0.000 | 0.124 | 0.000 | ||
| 2 spectra, MAQTIMK | 0.000 | 0.811 | 0.000 | 0.000 | 0.000 | 0.000 | 0.189 | 0.000 | ||
| 2 spectra, EAAFSLAEAK | 0.000 | 0.749 | 0.000 | 0.000 | 0.000 | 0.000 | 0.251 | 0.000 | ||
| 4 spectra, MLMGEVMR | 0.000 | 0.846 | 0.000 | 0.000 | 0.000 | 0.000 | 0.154 | 0.000 | ||
| 2 spectra, IEIFPSR | 0.000 | 0.813 | 0.000 | 0.000 | 0.000 | 0.000 | 0.187 | 0.000 |
| Plot | Mito | Lyso or Perox | ER | Golgi | PM | Cytosol | Nucleus | ||||||
| Expt B |
3 peptides |
4 spectra |
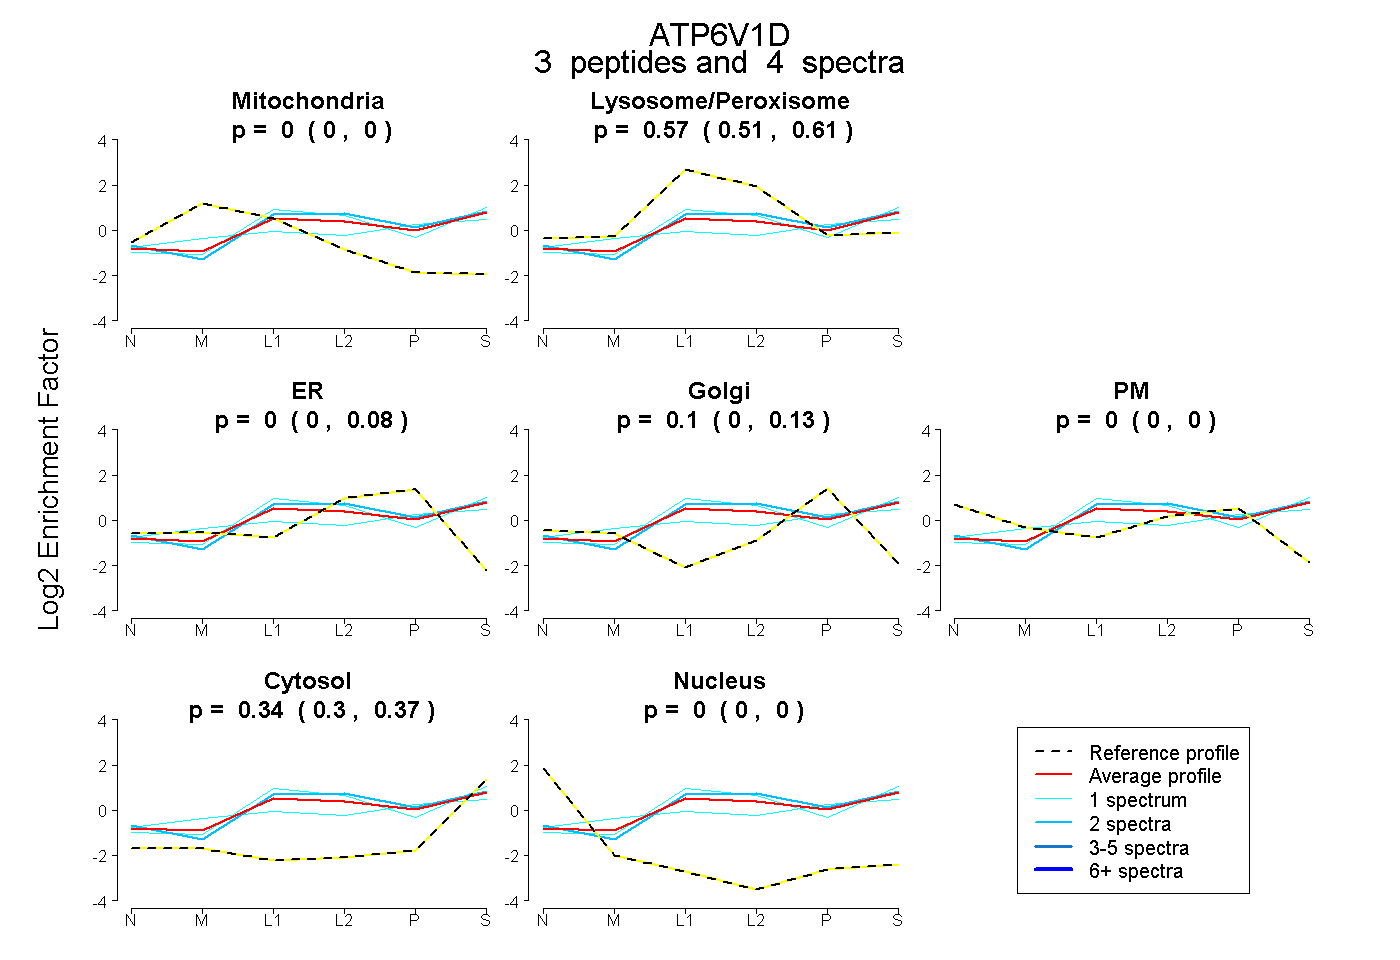 |
0.000 0.000 | 0.000 |
0.566 0.508 | 0.606 |
0.000 0.000 | 0.083 |
0.096 0.000 | 0.130 |
0.000 0.000 | 0.000 |
0.339 0.304 | 0.374 |
0.000 0.000 | 0.000 |
|||
| Plot | Lyso | Other | |||||||||||
| Expt C |
8 peptides |
48 spectra |
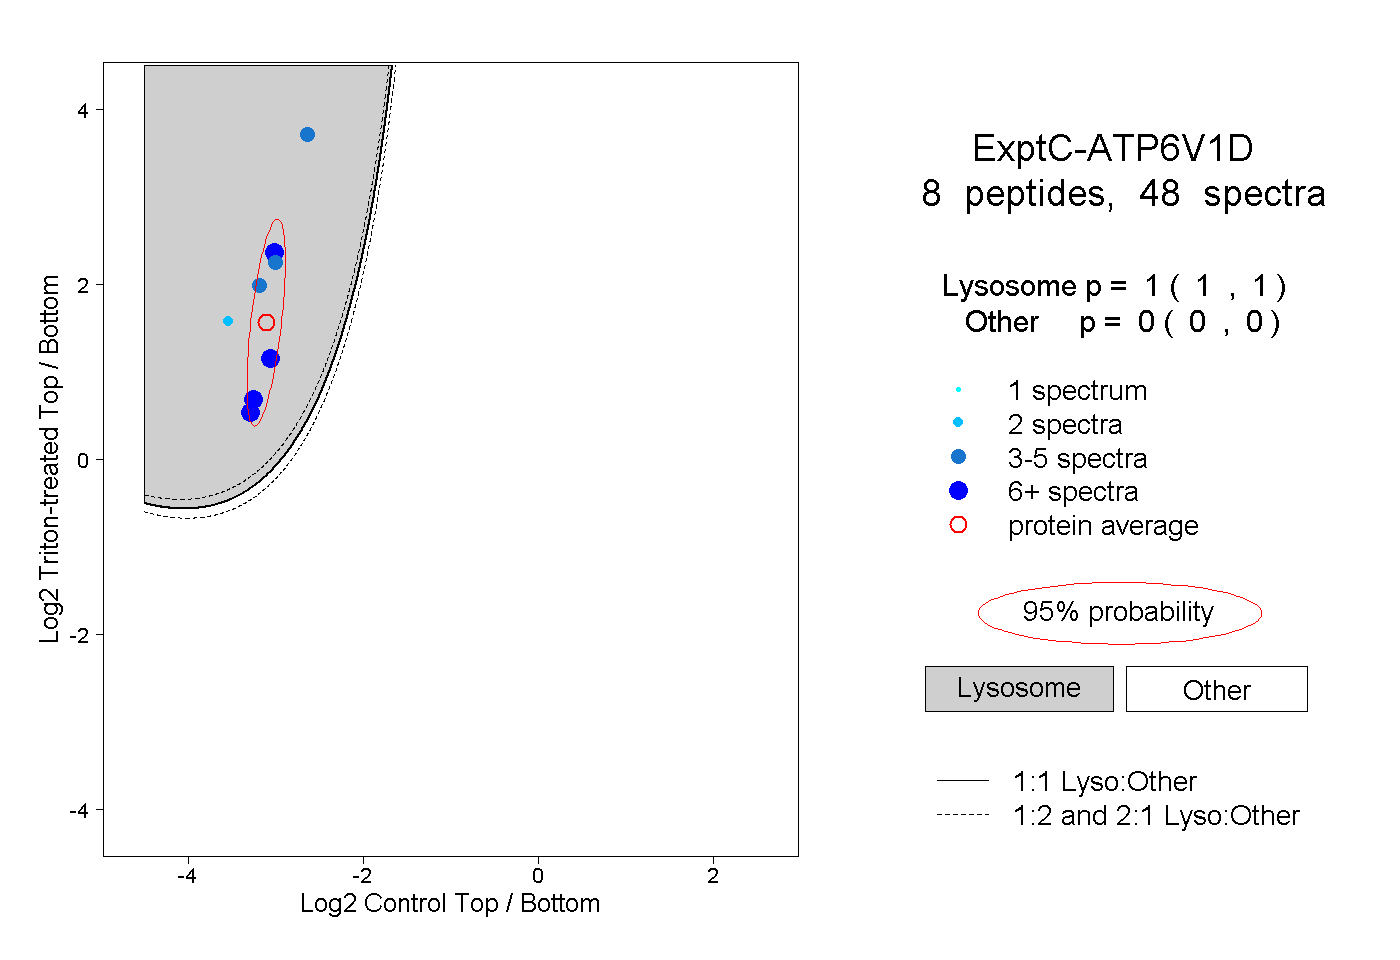 |
1.000 1.000 | 1.000 |
0.000 0.000 | 0.000 |