 7
7peptides
spectra
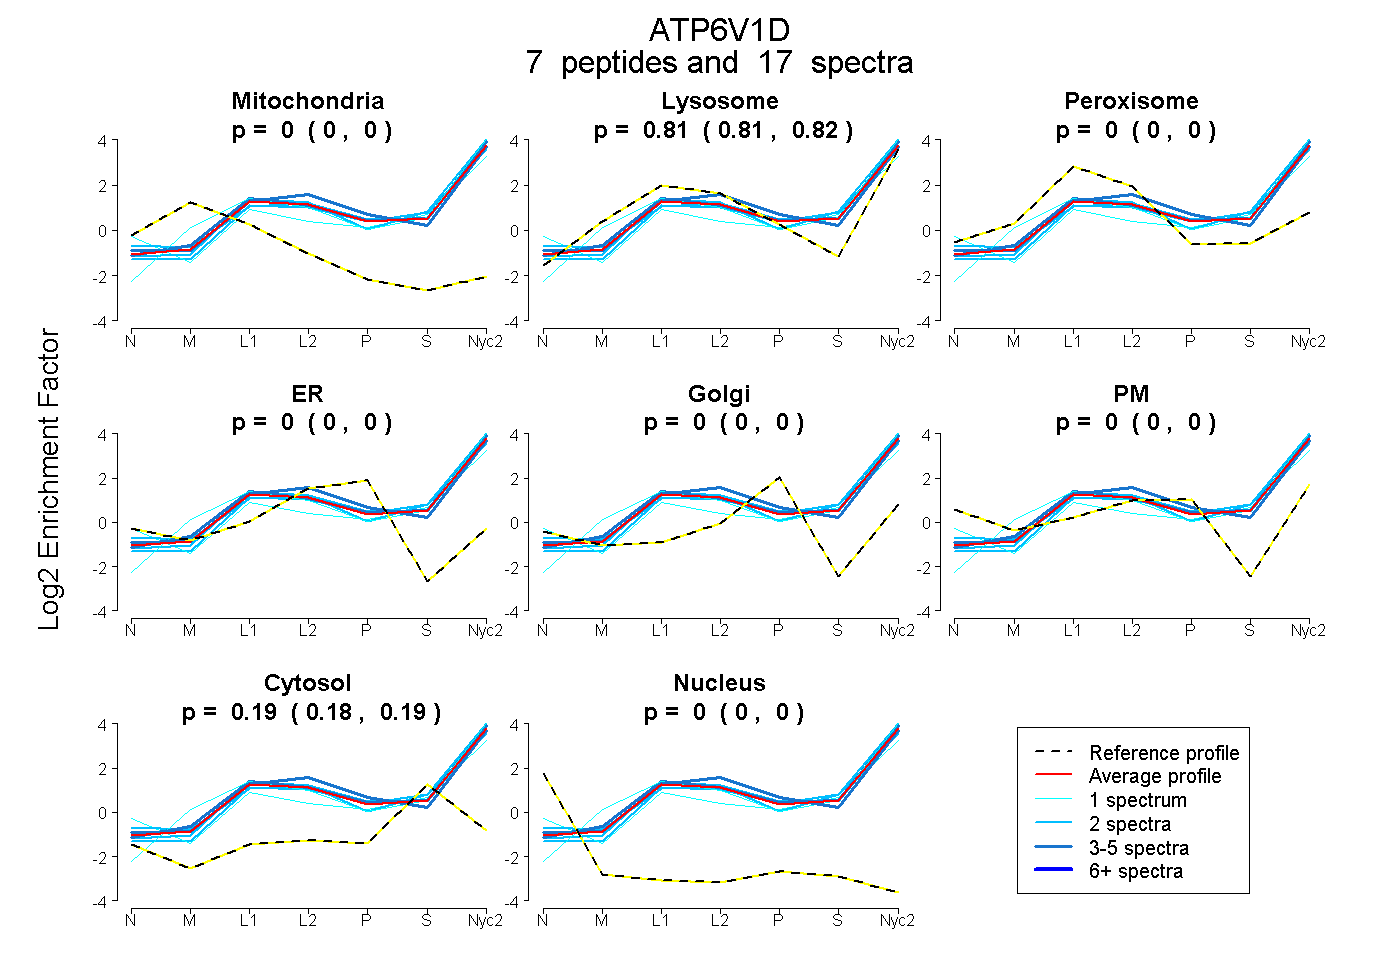
0.000 | 0.000
0.806 | 0.819
0.000 | 0.000
0.000 | 0.000
0.000 | 0.000
0.000 | 0.000
0.180 | 0.193
0.000 | 0.000
3peptides
spectra
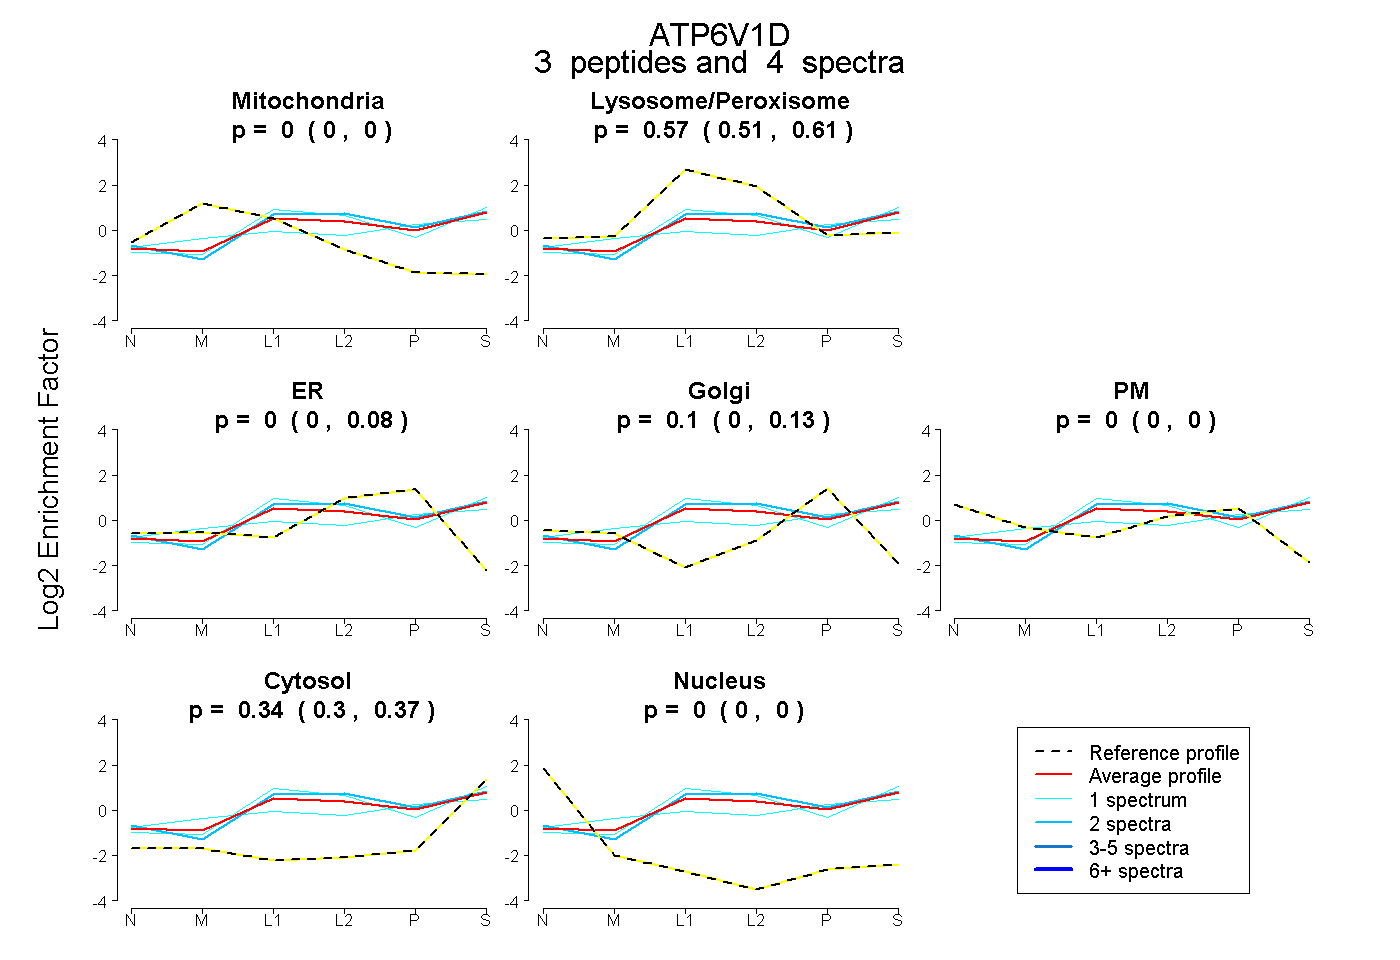
0.000 | 0.000
0.508 | 0.606
0.000 | 0.083
0.000 | 0.130
0.000 | 0.000
0.304 | 0.374
0.000 | 0.000
8peptides
spectra
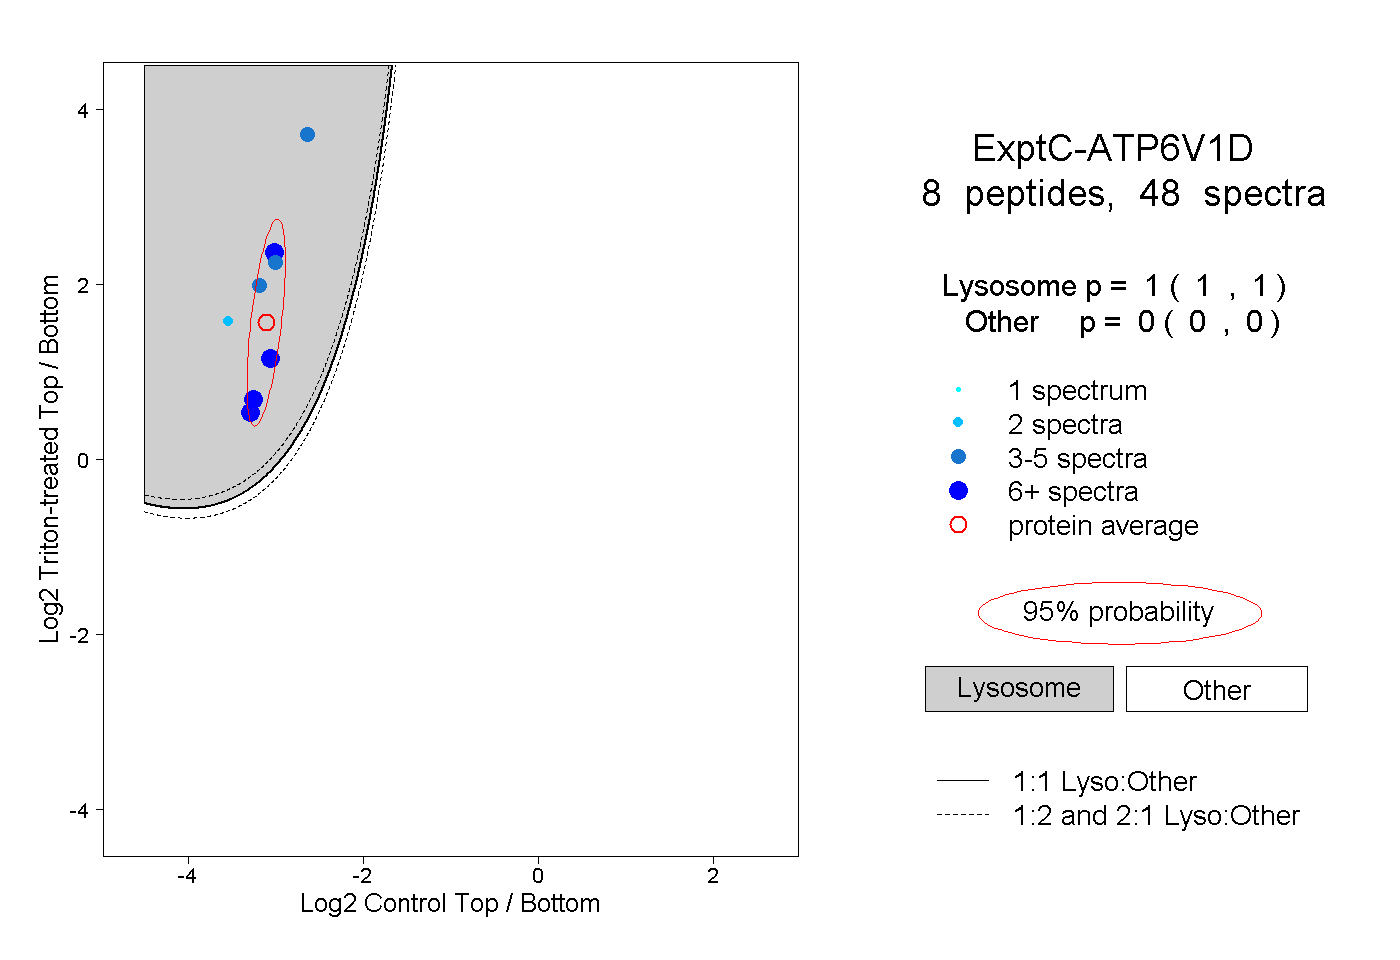
1.000 | 1.000
0.000 | 0.000