 10
10peptides
spectra
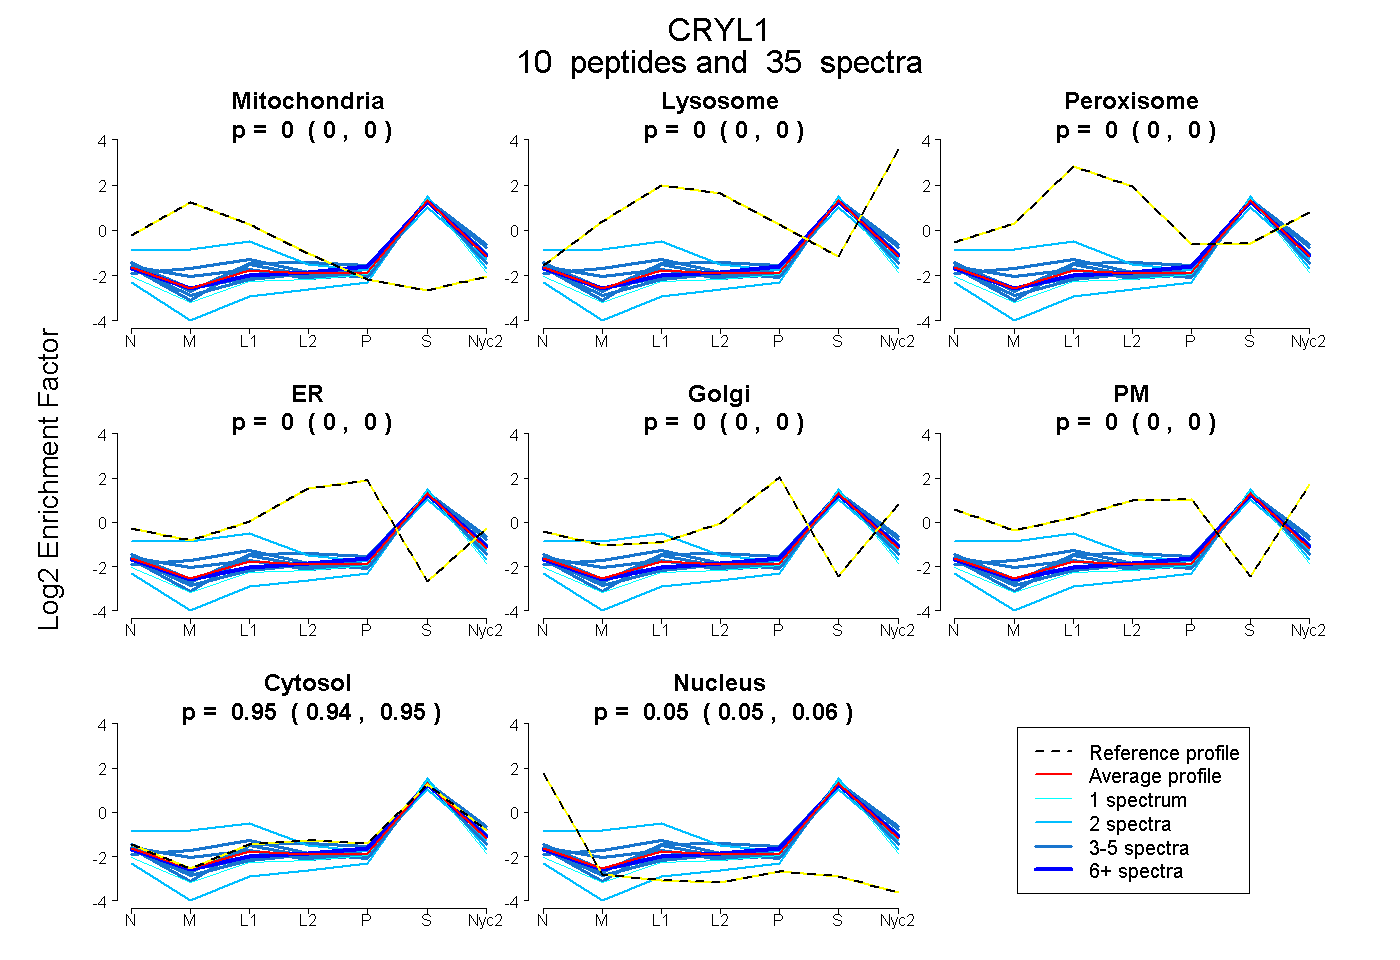
0.000 | 0.000
0.000 | 0.000
0.000 | 0.000
0.000 | 0.000
0.000 | 0.000
0.000 | 0.000
0.942 | 0.950
0.049 | 0.057
| Plot | Mito | Lyso | Perox | ER | Golgi | PM | Cytosol | Nucleus | |||||
| Expt A |
10 peptides |
35 spectra |
|
0.000 0.000 | 0.000 |
0.000 0.000 | 0.000 |
0.000 0.000 | 0.000 |
0.000 0.000 | 0.000 |
0.000 0.000 | 0.000 |
0.000 0.000 | 0.000 |
0.947 0.942 | 0.950 |
0.053 0.049 | 0.057 |
| 4 spectra, IFAQLDR | 0.000 | 0.000 | 0.000 | 0.000 | 0.000 | 0.000 | 0.951 | 0.049 | ||
| 2 spectra, SWAMLFASGGFK | 0.000 | 0.000 | 0.000 | 0.000 | 0.000 | 0.000 | 0.883 | 0.117 | ||
| 5 spectra, LFTGLAHVK | 0.000 | 0.000 | 0.000 | 0.000 | 0.000 | 0.000 | 0.942 | 0.058 | ||
| 1 spectrum, YAFIGPLETMHLNAEGMVSYCDR | 0.000 | 0.000 | 0.000 | 0.000 | 0.000 | 0.000 | 0.905 | 0.095 | ||
| 2 spectra, SLEQSGSLK | 0.262 | 0.000 | 0.038 | 0.000 | 0.000 | 0.000 | 0.700 | 0.000 | ||
| 5 spectra, EIDGFVLNR | 0.000 | 0.000 | 0.000 | 0.000 | 0.000 | 0.000 | 0.984 | 0.016 | ||
| 6 spectra, VPDDPEHLAAR | 0.000 | 0.000 | 0.000 | 0.000 | 0.000 | 0.000 | 0.949 | 0.051 | ||
| 4 spectra, VNQDMCMK | 0.108 | 0.000 | 0.000 | 0.000 | 0.000 | 0.000 | 0.892 | 0.000 | ||
| 3 spectra, DDCLMQLSK | 0.000 | 0.000 | 0.000 | 0.000 | 0.000 | 0.000 | 0.971 | 0.029 | ||
| 3 spectra, LQYAIISEAWR | 0.013 | 0.000 | 0.000 | 0.000 | 0.000 | 0.000 | 0.939 | 0.048 |
| Plot | Mito | Lyso or Perox | ER | Golgi | PM | Cytosol | Nucleus | ||||||
| Expt B |
6 peptides |
17 spectra |
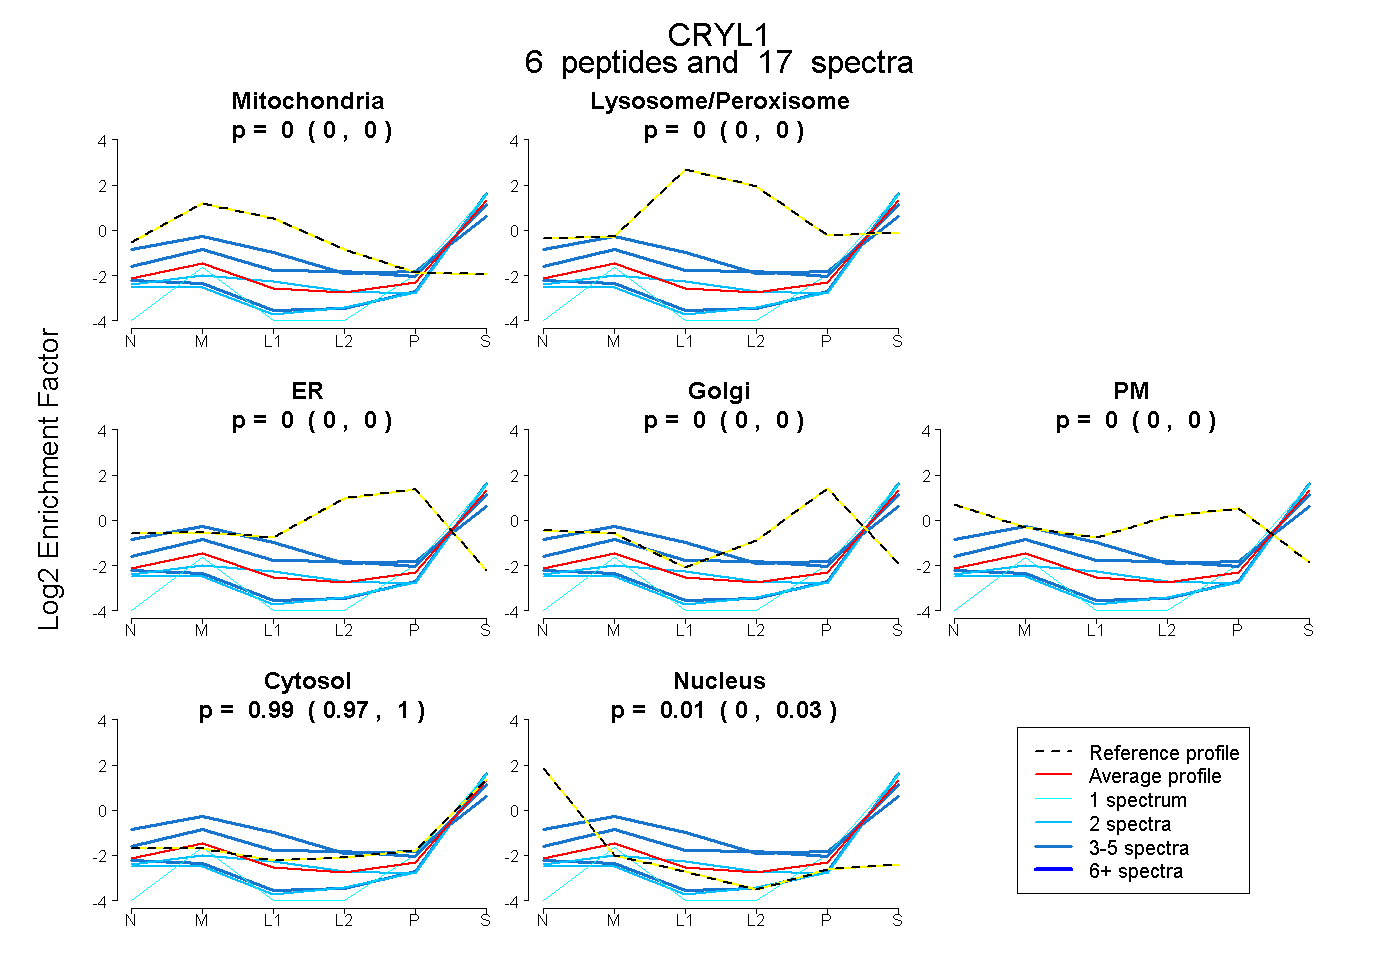 |
0.000 0.000 | 0.000 |
0.000 0.000 | 0.000 |
0.000 0.000 | 0.000 |
0.000 0.000 | 0.000 |
0.000 0.000 | 0.000 |
0.994 0.967 | 1.000 |
0.006 0.000 | 0.028 |
|||
| Plot | Lyso | Other | |||||||||||
| Expt C |
8 peptides |
21 spectra |
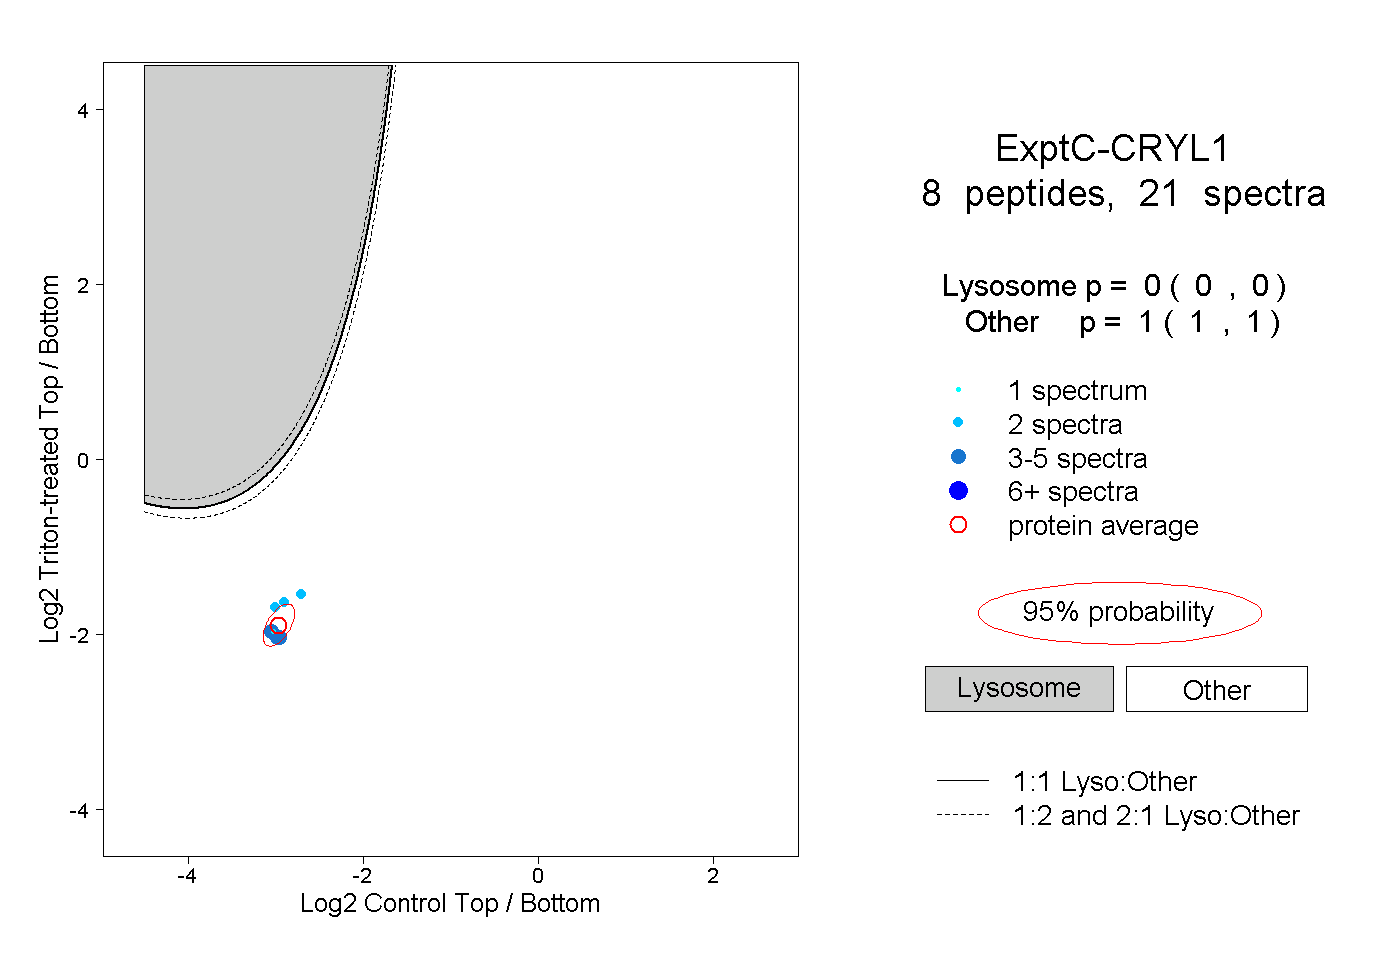 |
0.000 0.000 | 0.000 |
1.000 1.000 | 1.000 |