7
7peptides
spectra
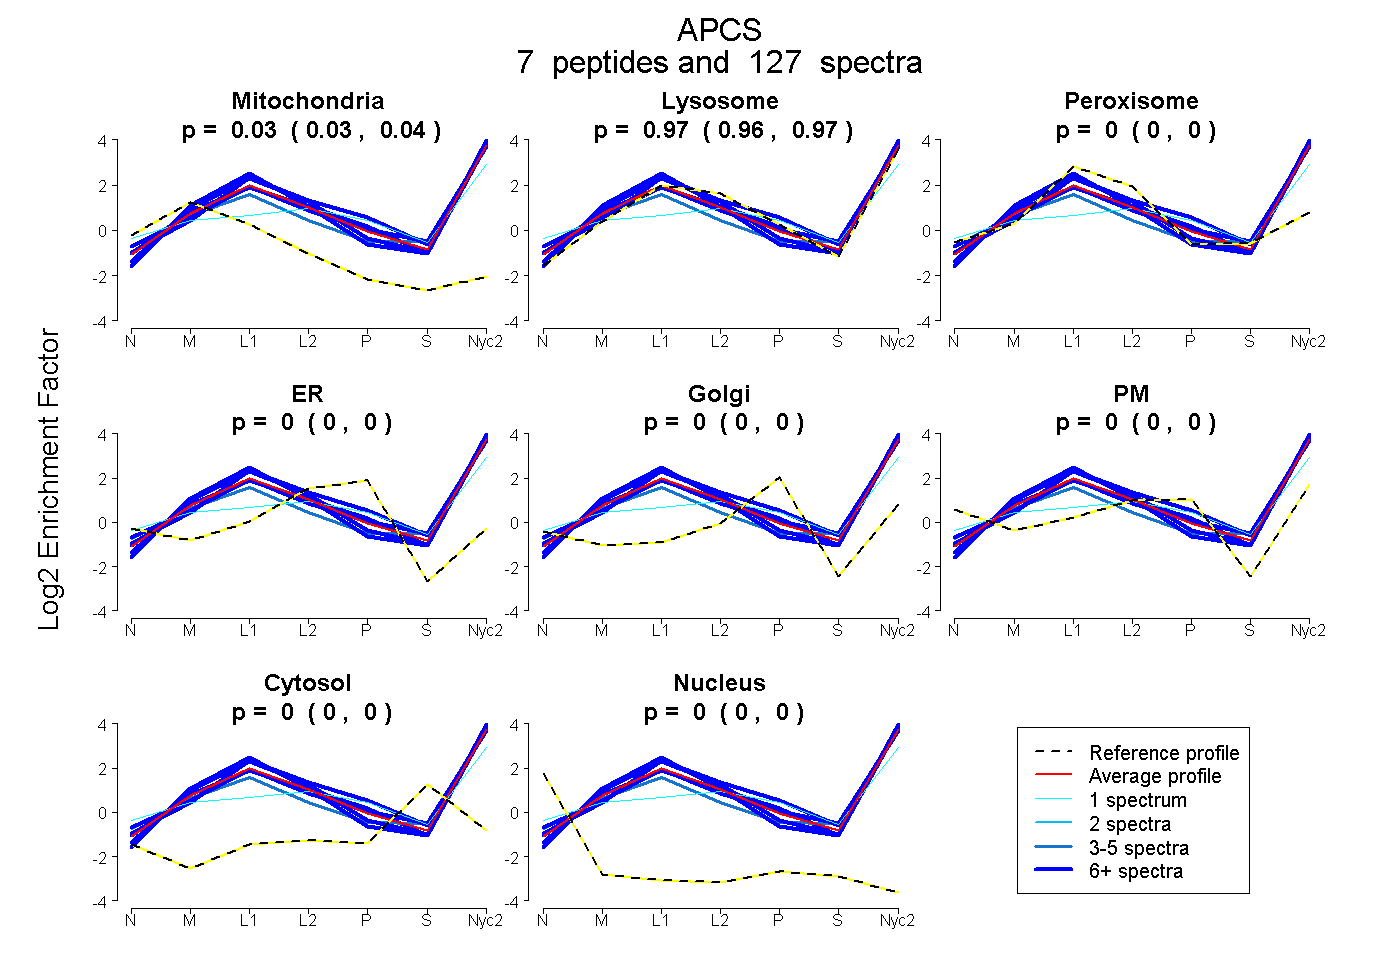
0.030 | 0.036
0.963 | 0.968
0.000 | 0.000
0.000 | 0.000
0.000 | 0.000
0.000 | 0.000
0.000 | 0.004
0.000 | 0.000
8peptides
spectra
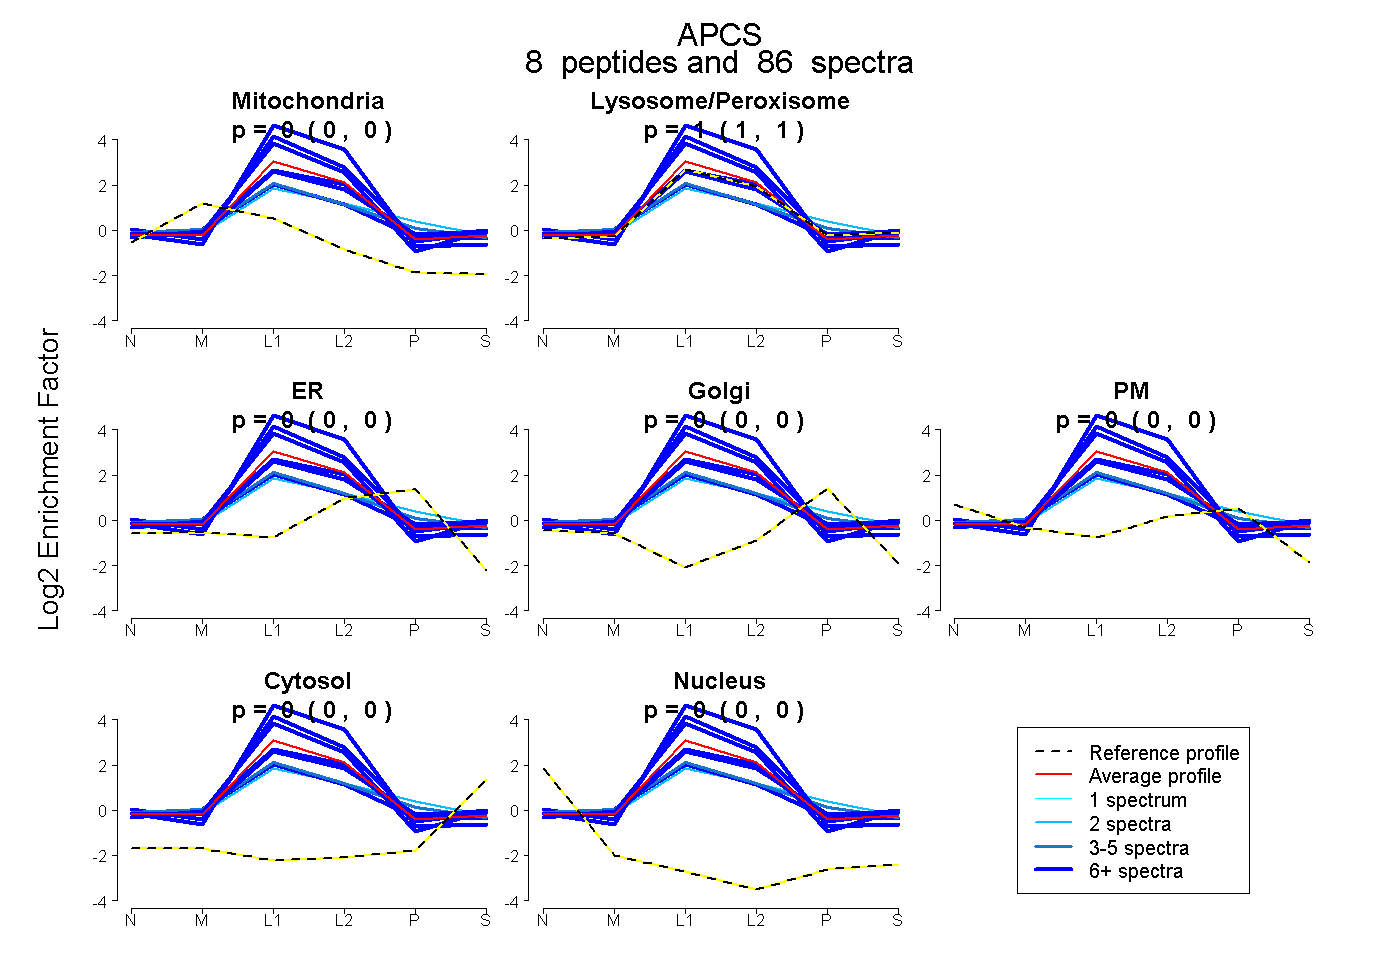
0.000 | 0.000
1.000 | 1.000
0.000 | 0.000
0.000 | 0.000
0.000 | 0.000
0.000 | 0.000
0.000 | 0.000
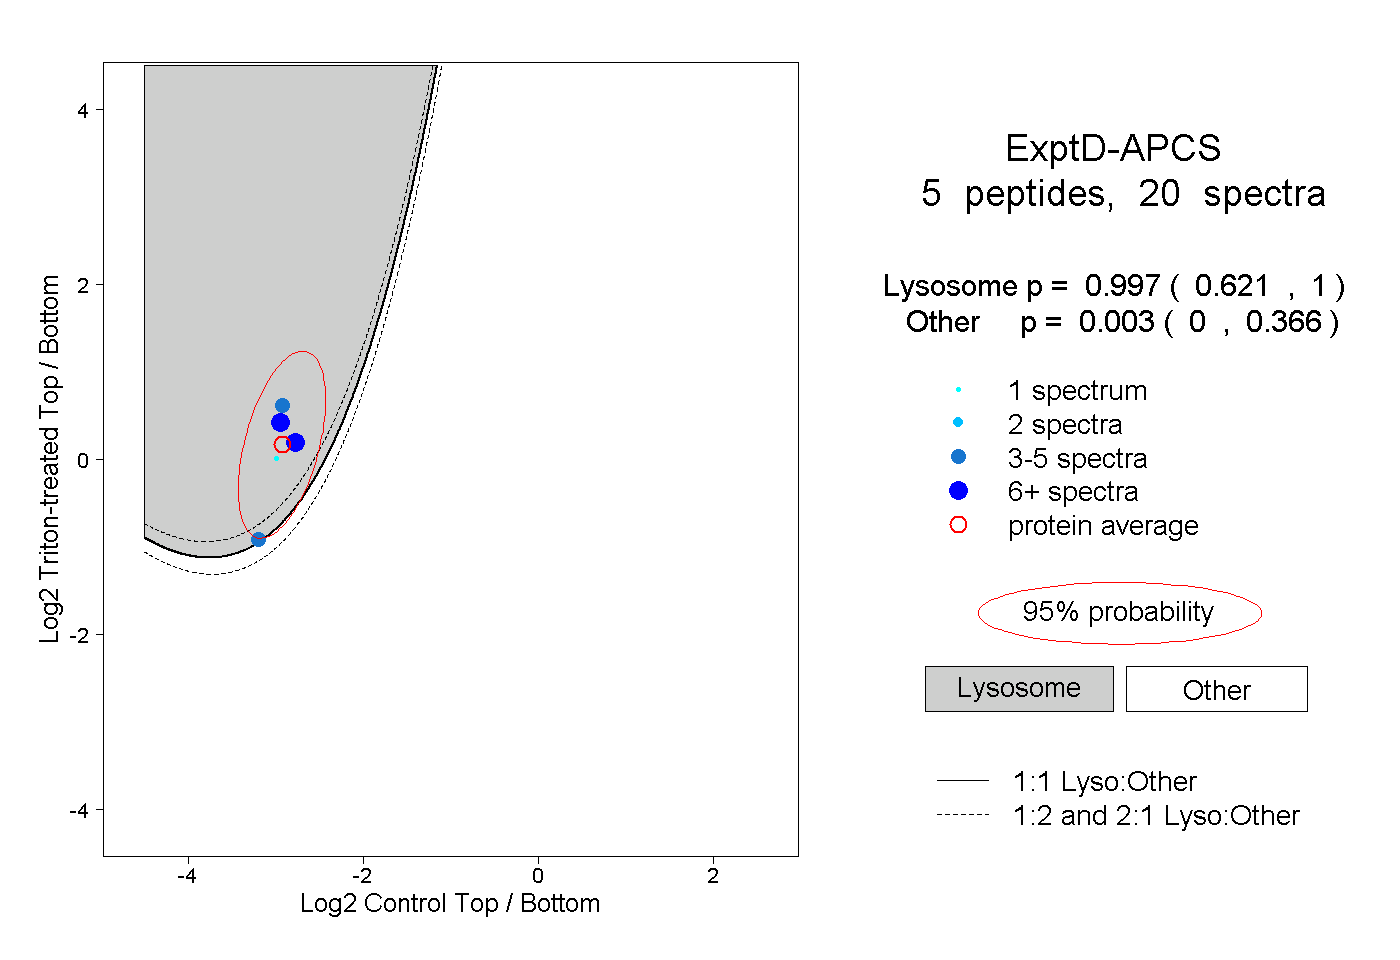
8peptides
spectra
1.000 | 1.000
0.000 | 0.000