 7
7peptides
spectra
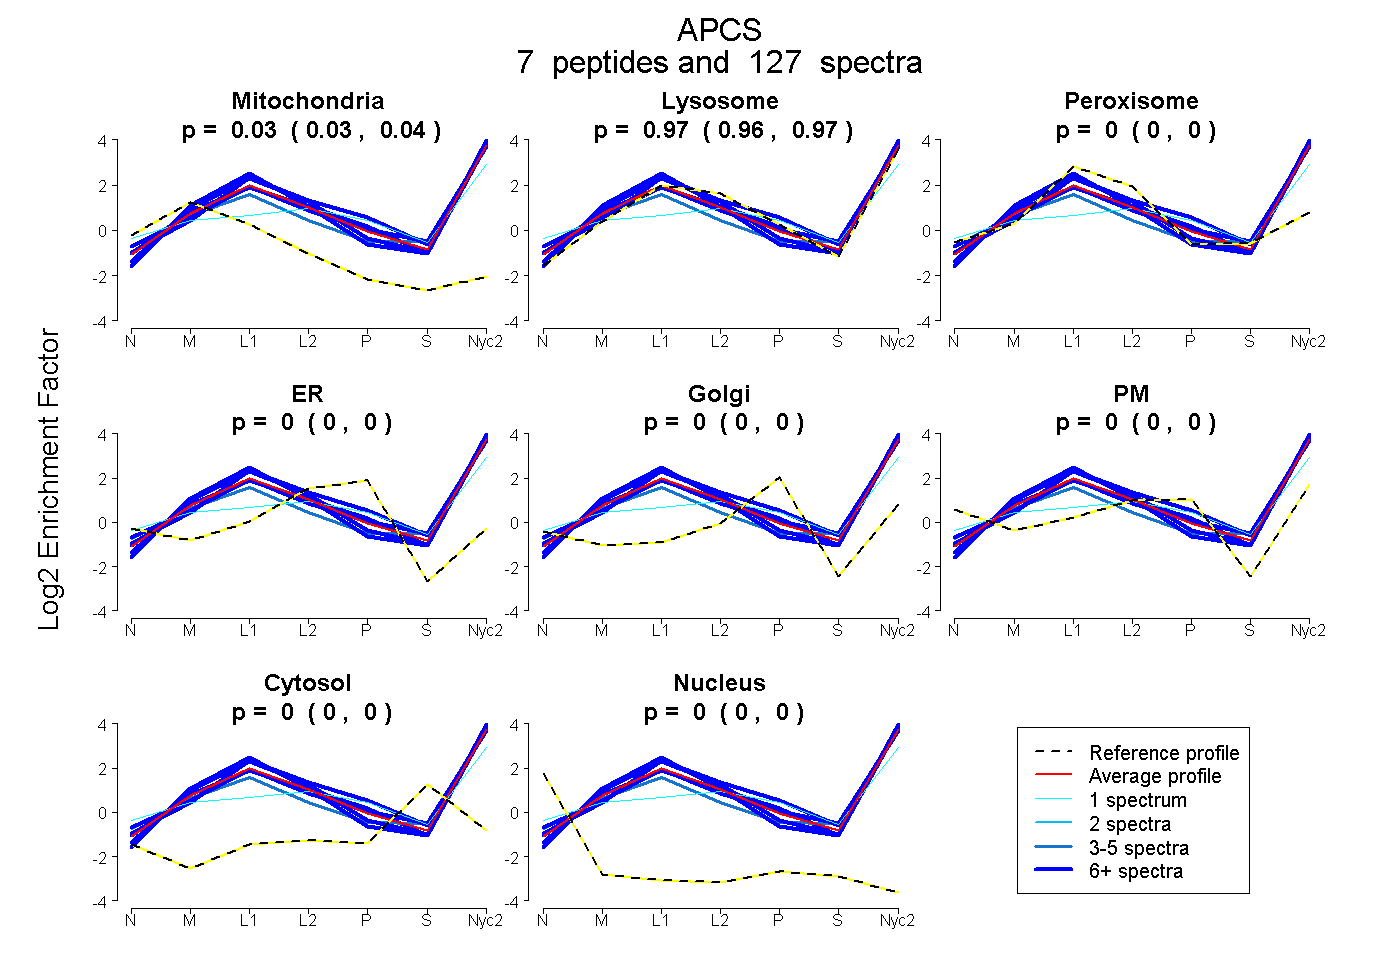
0.030 | 0.036
0.963 | 0.968
0.000 | 0.000
0.000 | 0.000
0.000 | 0.000
0.000 | 0.000
0.000 | 0.004
0.000 | 0.000
| Plot | Mito | Lyso | Perox | ER | Golgi | PM | Cytosol | Nucleus | |||||
| Expt A |
7 peptides |
127 spectra |
|
0.034 0.030 | 0.036 |
0.966 0.963 | 0.968 |
0.000 0.000 | 0.000 |
0.000 0.000 | 0.000 |
0.000 0.000 | 0.000 |
0.000 0.000 | 0.000 |
0.000 0.000 | 0.004 |
0.000 0.000 | 0.000 |
| 8 spectra, ESETDYVK | 0.000 | 0.946 | 0.000 | 0.000 | 0.000 | 0.000 | 0.043 | 0.011 | ||
| 21 spectra, SQSLFSYSVNSR | 0.016 | 0.984 | 0.000 | 0.000 | 0.000 | 0.000 | 0.000 | 0.000 | ||
| 63 spectra, VFVFPR | 0.005 | 0.995 | 0.000 | 0.000 | 0.000 | 0.000 | 0.000 | 0.000 | ||
| 1 spectrum, VGQYSLYIGNSK | 0.000 | 0.603 | 0.000 | 0.000 | 0.000 | 0.285 | 0.112 | 0.000 | ||
| 3 spectra, DNELLIYK | 0.014 | 0.891 | 0.000 | 0.000 | 0.000 | 0.000 | 0.067 | 0.028 | ||
| 22 spectra, AYSDLSR | 0.020 | 0.962 | 0.000 | 0.000 | 0.000 | 0.019 | 0.000 | 0.000 | ||
| 9 spectra, GFPPNPNILDWR | 0.000 | 0.984 | 0.016 | 0.000 | 0.000 | 0.000 | 0.000 | 0.000 |
| Plot | Mito | Lyso or Perox | ER | Golgi | PM | Cytosol | Nucleus | ||||||
| Expt B |
8 peptides |
86 spectra |
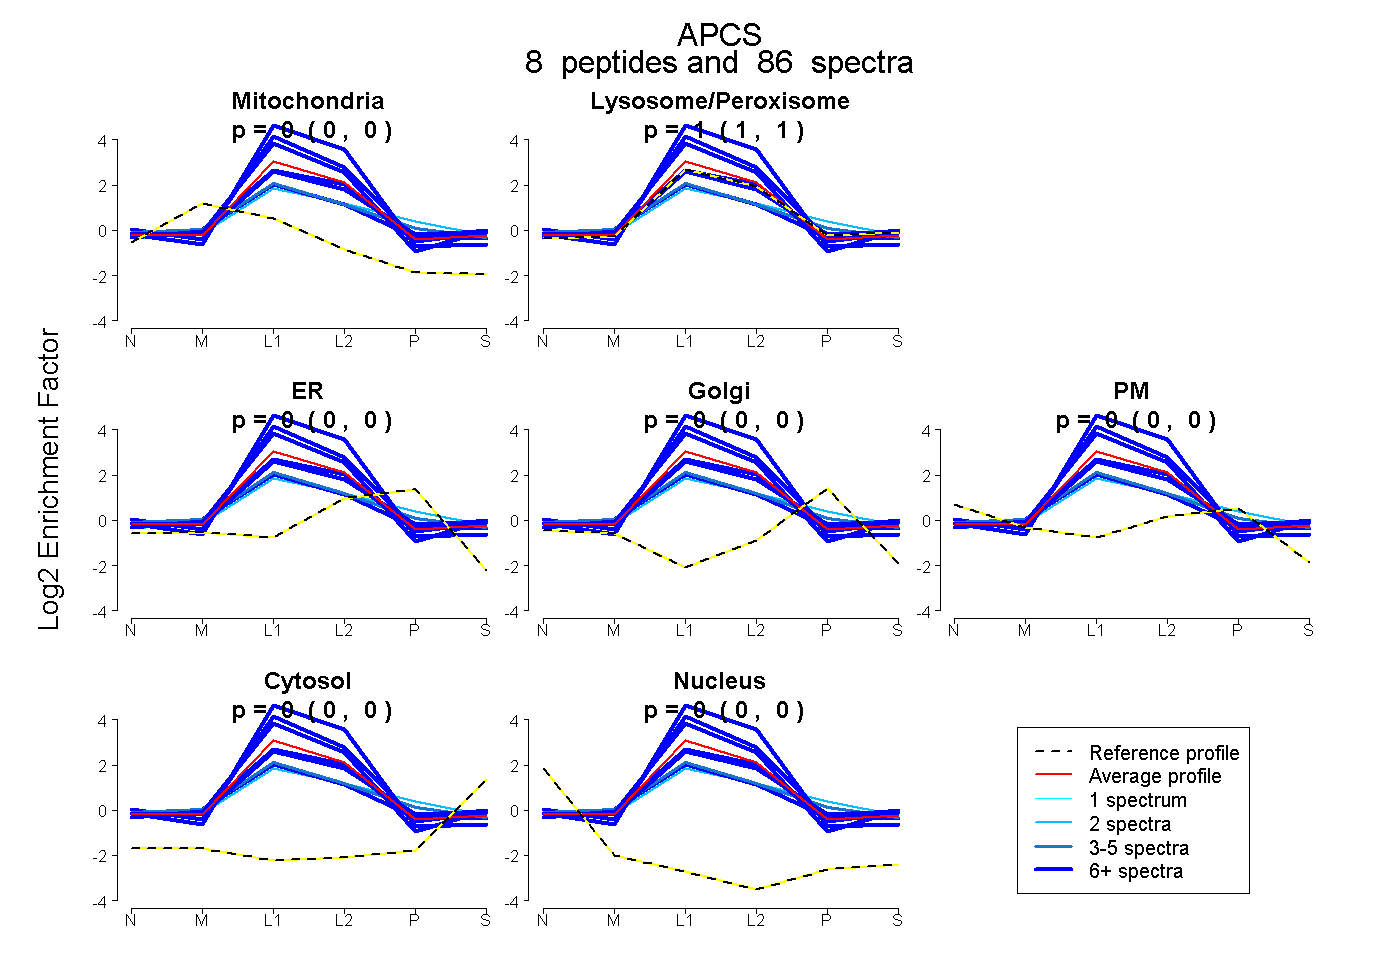 |
0.000 0.000 | 0.000 |
1.000 1.000 | 1.000 |
0.000 0.000 | 0.000 |
0.000 0.000 | 0.000 |
0.000 0.000 | 0.000 |
0.000 0.000 | 0.000 |
0.000 0.000 | 0.000 |
|||
| Plot | Lyso | Other | |||||||||||
| Expt C |
8 peptides |
886 spectra |
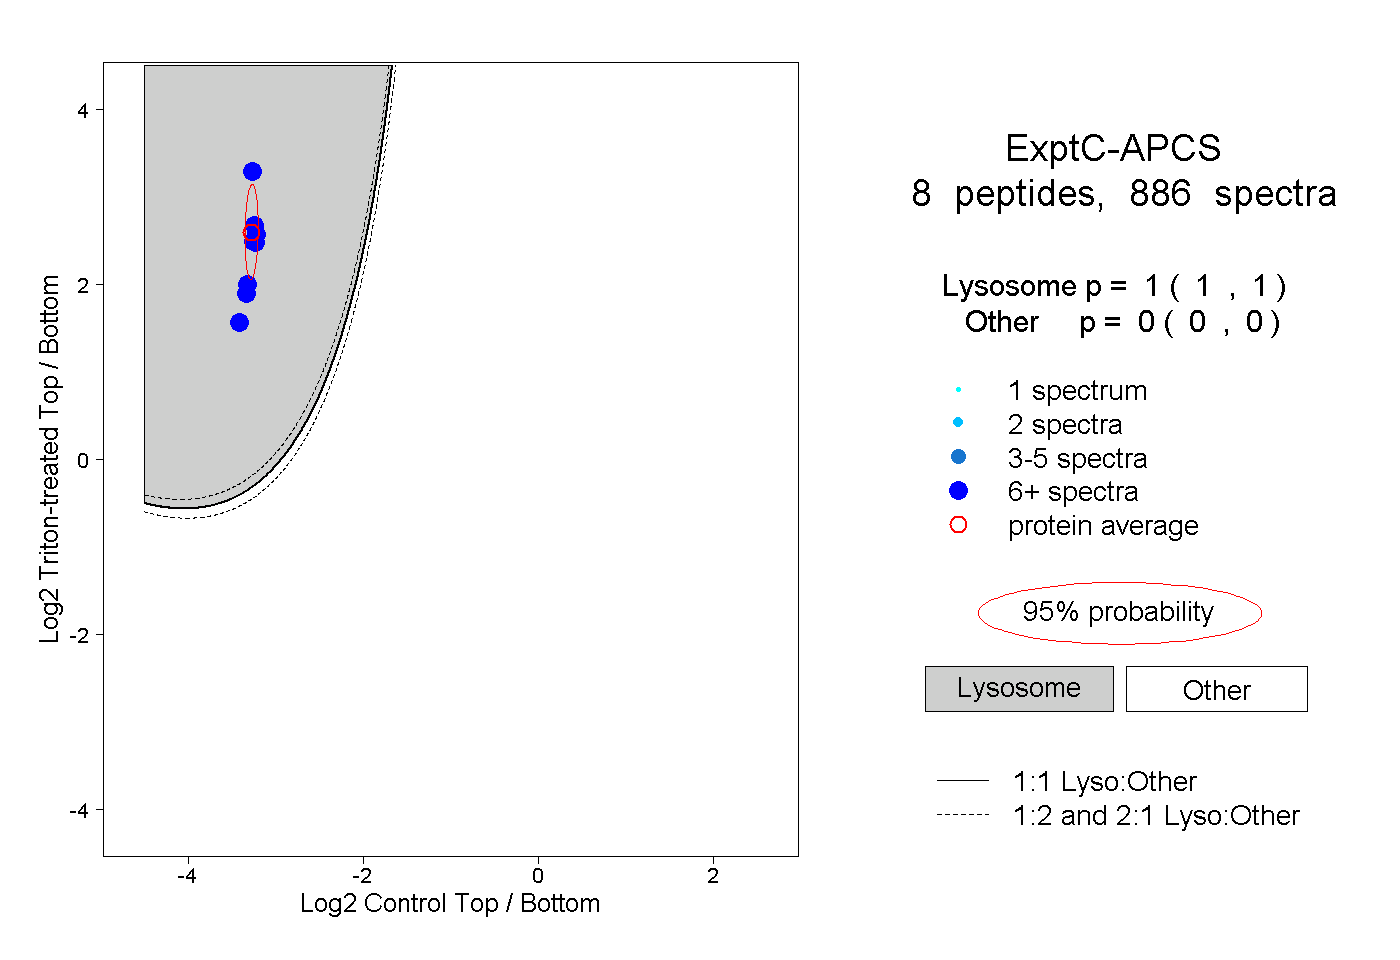 |
1.000 1.000 | 1.000 |
0.000 0.000 | 0.000 |
||||||||
| Plot | Lyso | Other | |||||||||||
| Expt D |
5 peptides |
20 spectra |
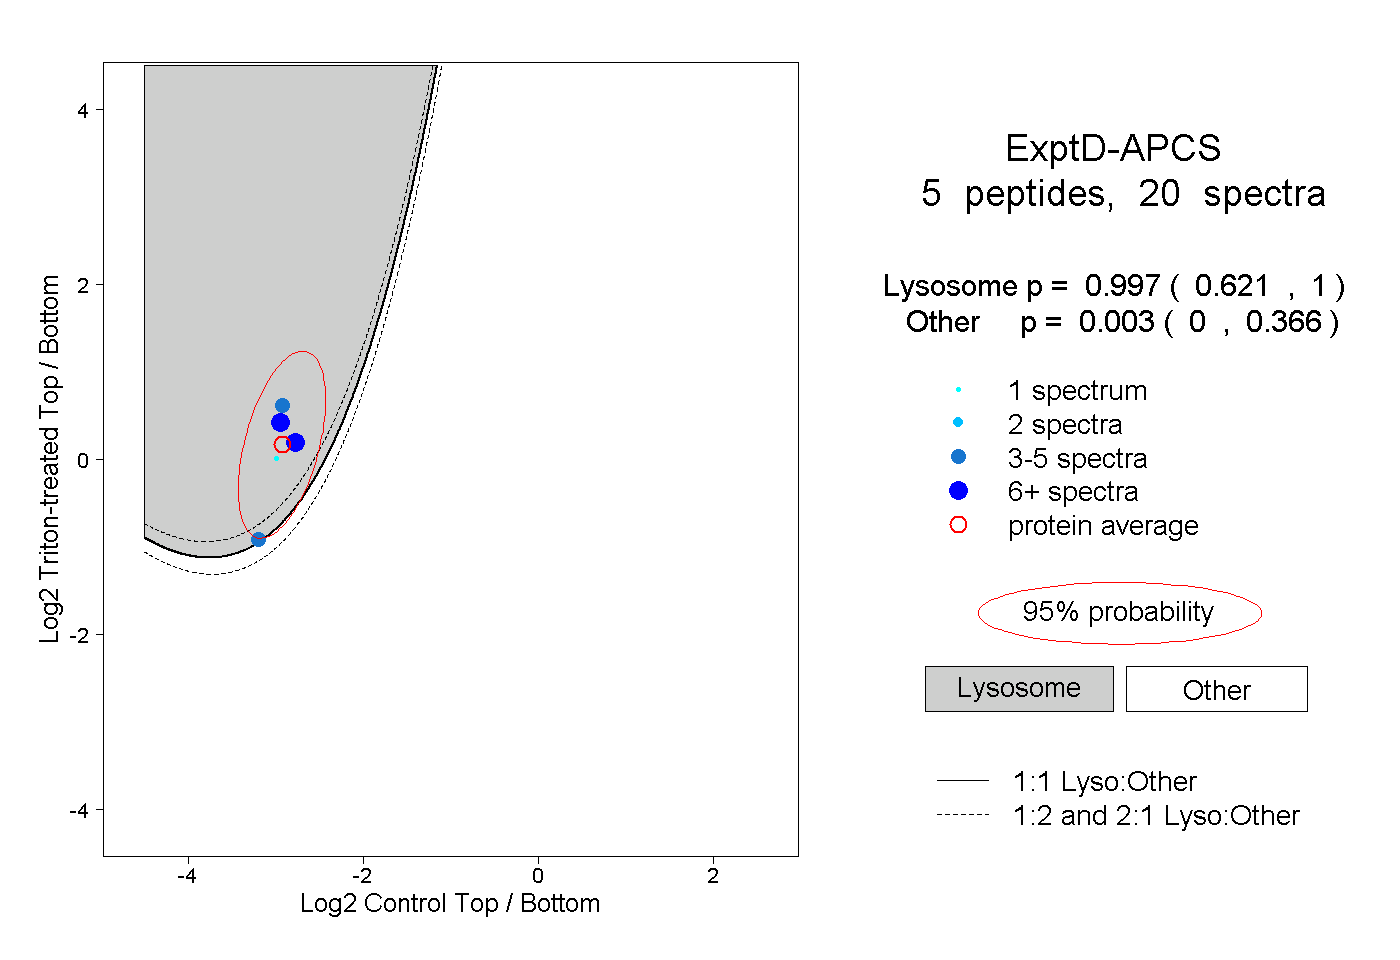 |
0.997 0.621 | 1.000 |
0.003 0.000 | 0.366 |