| 7 spectra, EQGYDVIAYLANIGQK |
|
0.000 |
|
|
|
|
|
|
|
1.000 |
| 123 spectra, MPEFYNR |
|
0.000 |
|
|
|
|
|
|
|
1.000 |
| 59 spectra, QHGIPIPVTPK |
|
0.000 |
|
|
|
|
|
|
|
1.000 |
| 1 spectrum, DGTTHSTSLDLFMYLNEVAGK |
|
0.000 |
|
|
|
|
|
|
|
1.000 |
| 8 spectra, YLLGTSLARPCIAR |
|
0.000 |
|
|
|
|
|
|
|
1.000 |
| 6 spectra, APNTPDVLEIEFK |
|
0.000 |
|
|
|
|
|
|
|
1.000 |
| 76 spectra, VIAPWR |
|
0.000 |
|
|
|
|
|
|
|
1.000 |
| 61 spectra, QVEIAQR |
|
0.000 |
|
|
|
|
|
|
|
1.000 |
| 98 spectra, NDLMEYAK |
|
0.000 |
|
|
|
|
|
|
|
1.000 |
| 84 spectra, GQVYILGR |
|
0.000 |
|
|
|
|
|
|
|
1.000 |
| 61 spectra, VFIEDVSK |
|
0.000 |
|
|
|
|
|
|
|
1.000 |
| 111 spectra, TQDPAK |
|
0.000 |
|
|
|
|
|
|
|
1.000 |
| 4 spectra, EGLGIK |
|
0.000 |
|
|
|
|
|
|
|
1.000 |
| 17 spectra, FAELVYTGFWHSPECEFVR |
|
0.000 |
|
|
|
|
|
|
|
1.000 |
| 111 spectra, IDIVENR |
|
0.000 |
|
|
|
|
|
|
|
1.000 |
| 3 spectra, EDFEEVQK |
|
0.000 |
|
|
|
|
|
|
|
1.000 |
| 120 spectra, YVSHGATGK |
|
0.000 |
|
|
|
|
|
|
|
1.000 |
| 99 spectra, VQVSVFK |
|
0.000 |
|
|
|
|
|
|
|
1.000 |
| 84 spectra, NQAPPGLYTK |
|
0.000 |
|
|
|
|
|
|
|
1.000 |
| 6 spectra, FELTCYSLAPQIK |
|
0.000 |
|
|
|
|
|
|
|
1.000 |
| 99 spectra, QGLGLK |
|
0.000 |
|
|
|
|
|
|
|
1.000 |
| 49 spectra, EDFEEAR |
|
0.000 |
|
|
|
|
|
|
|
1.000 |
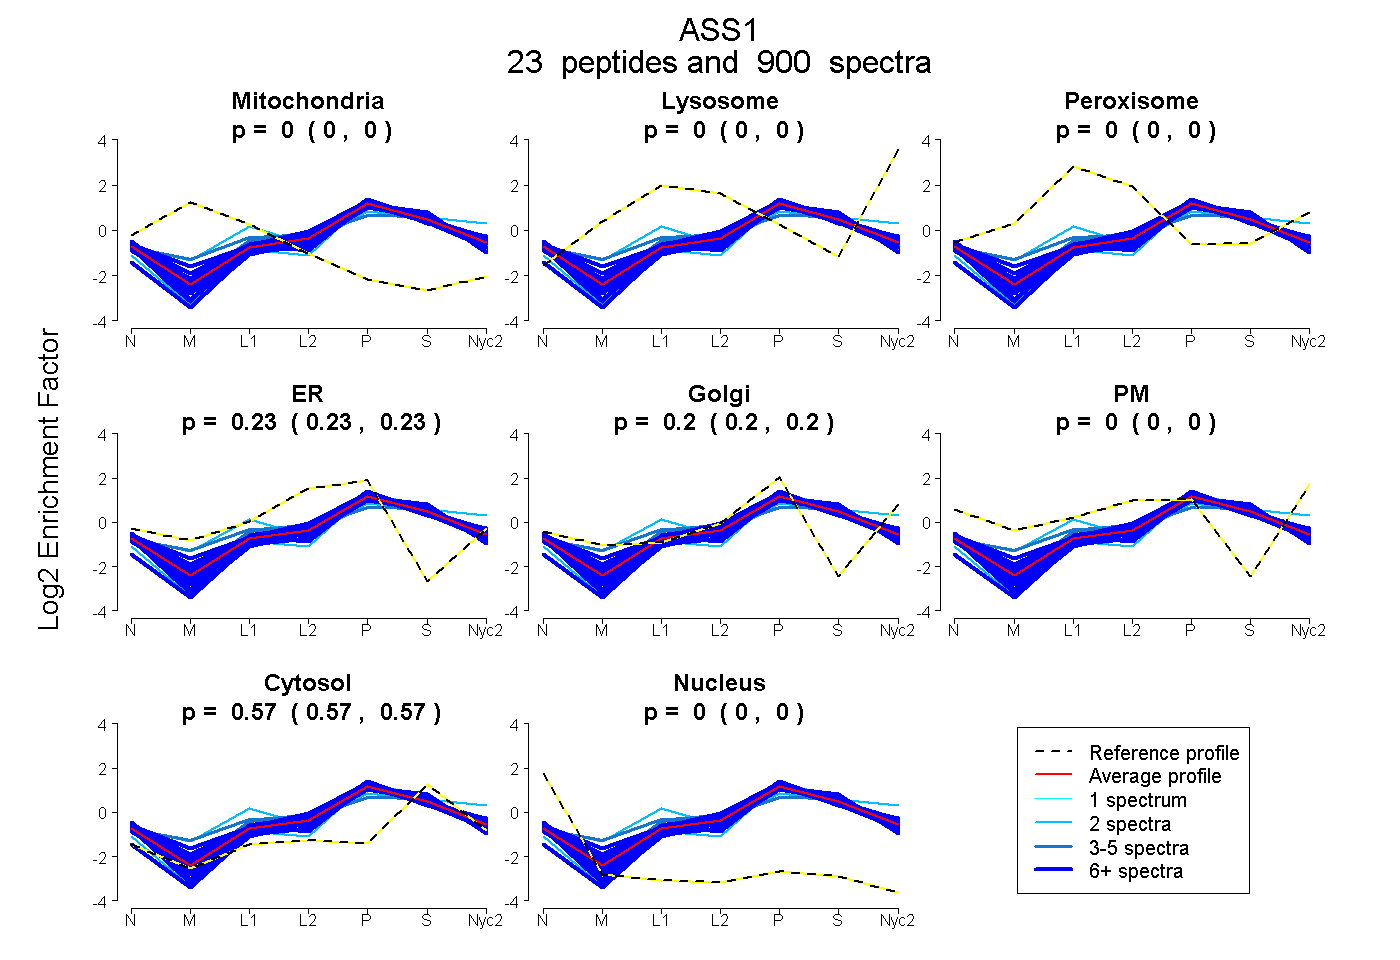
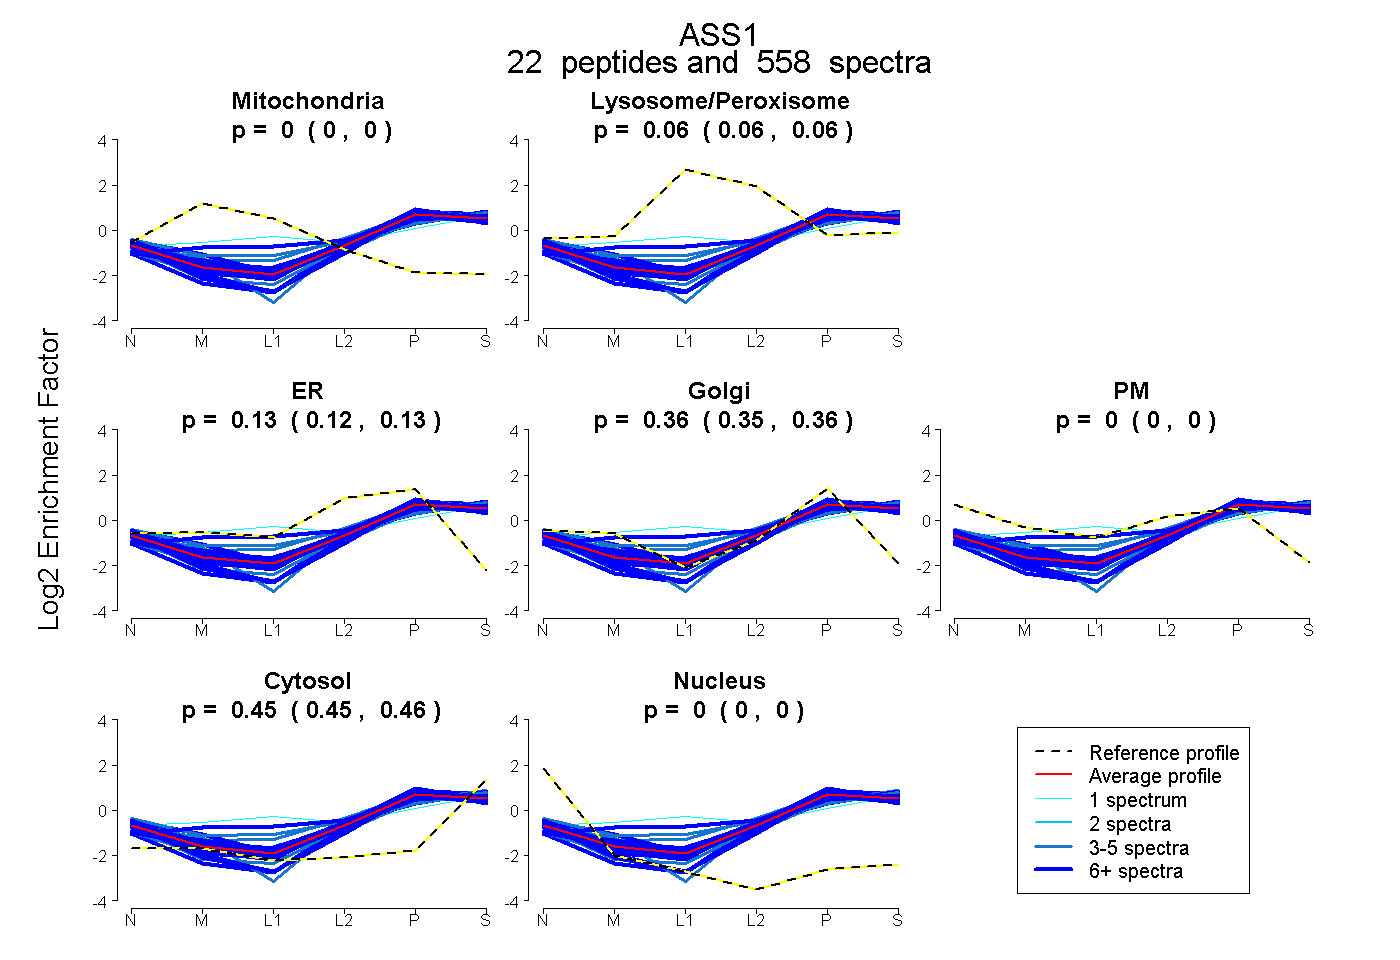
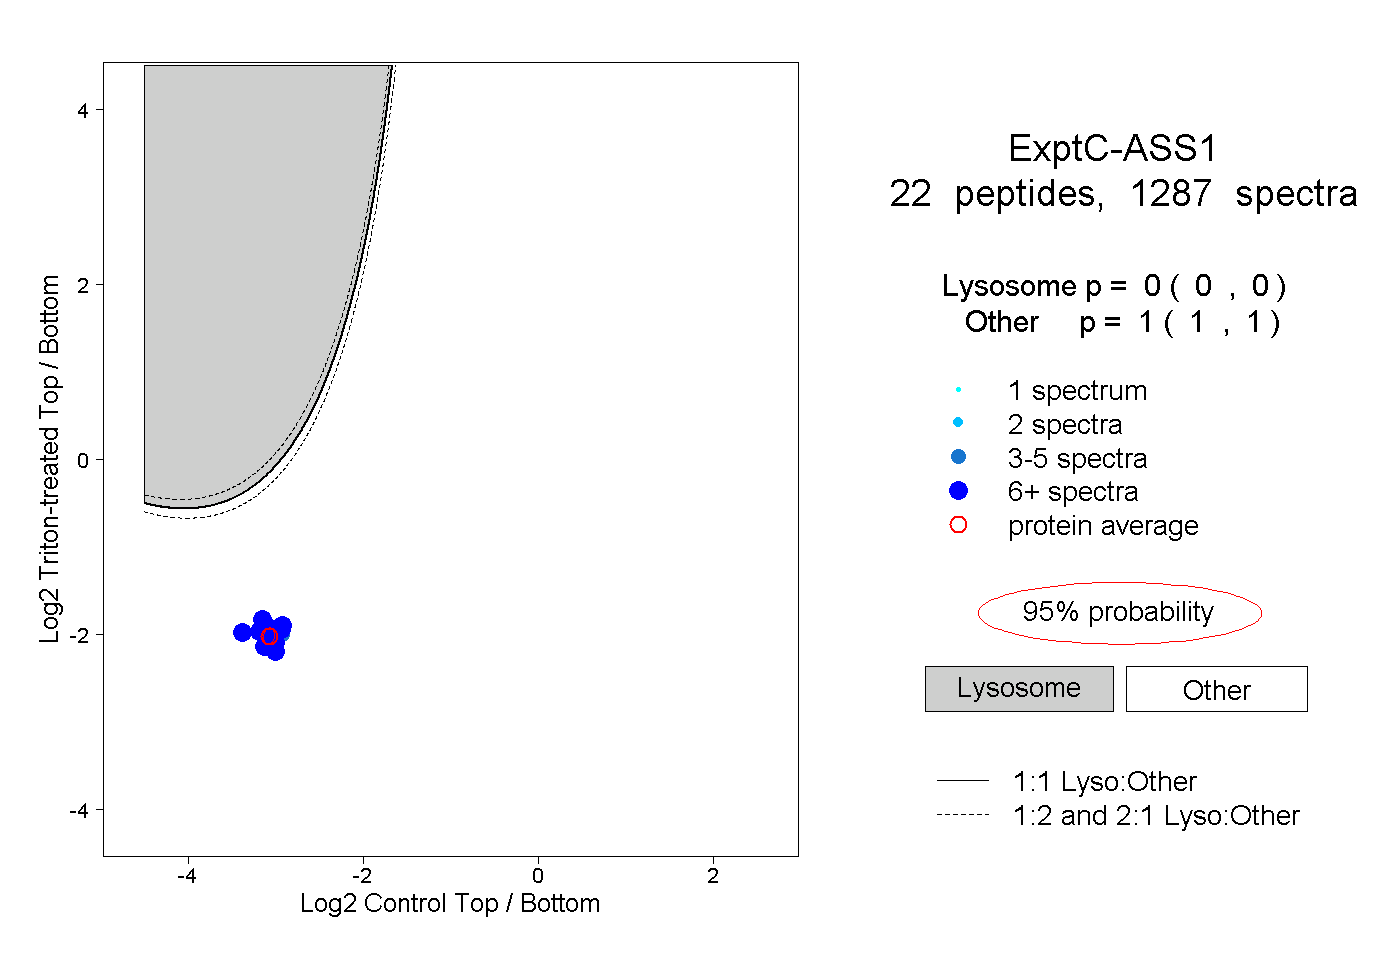
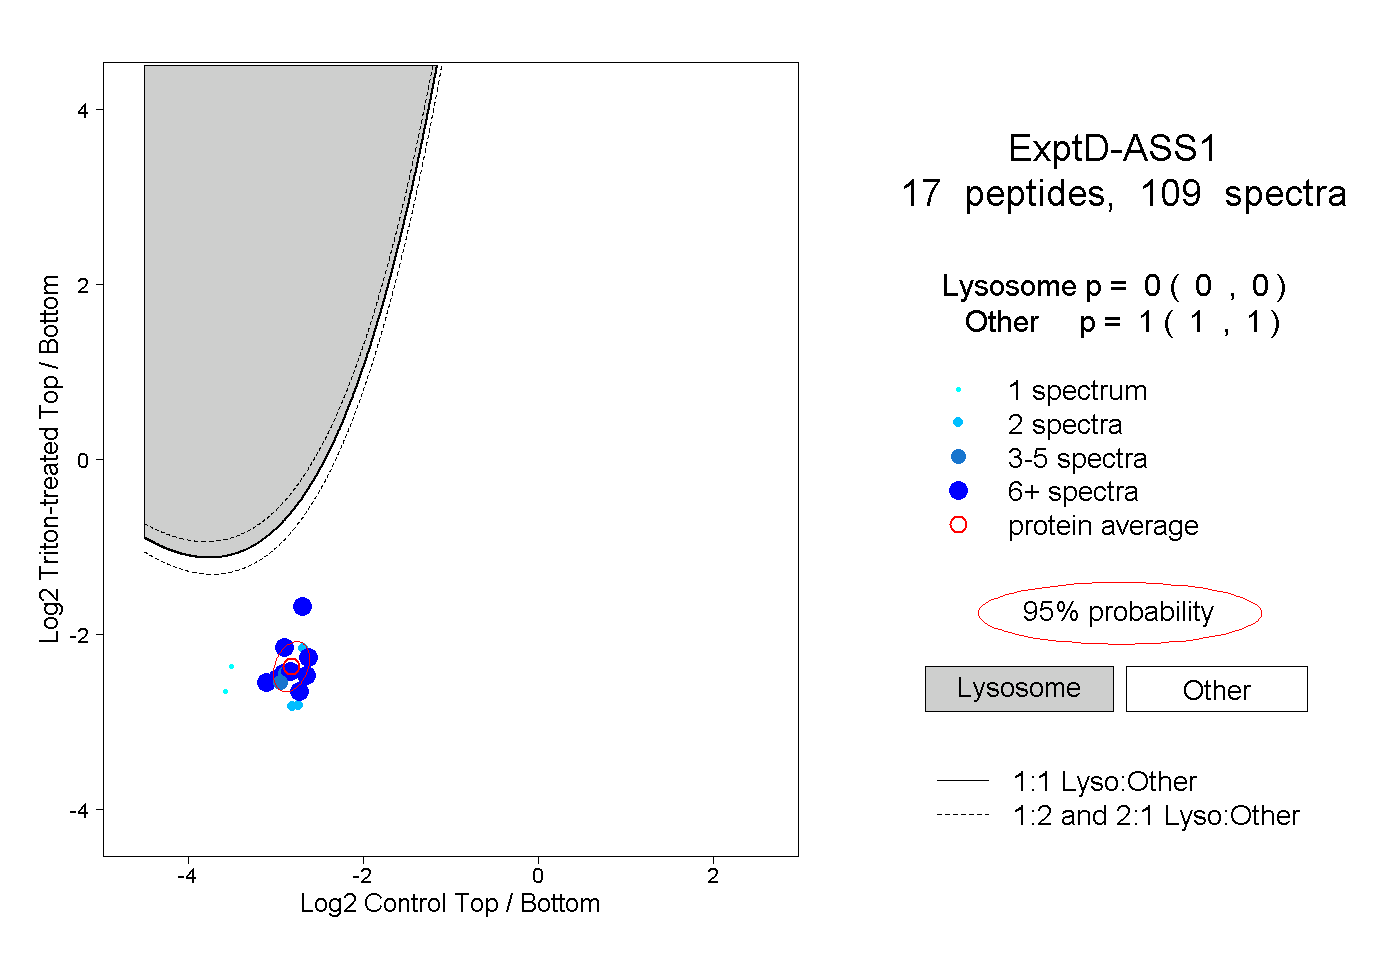
 23
23