 11
11peptides
spectra
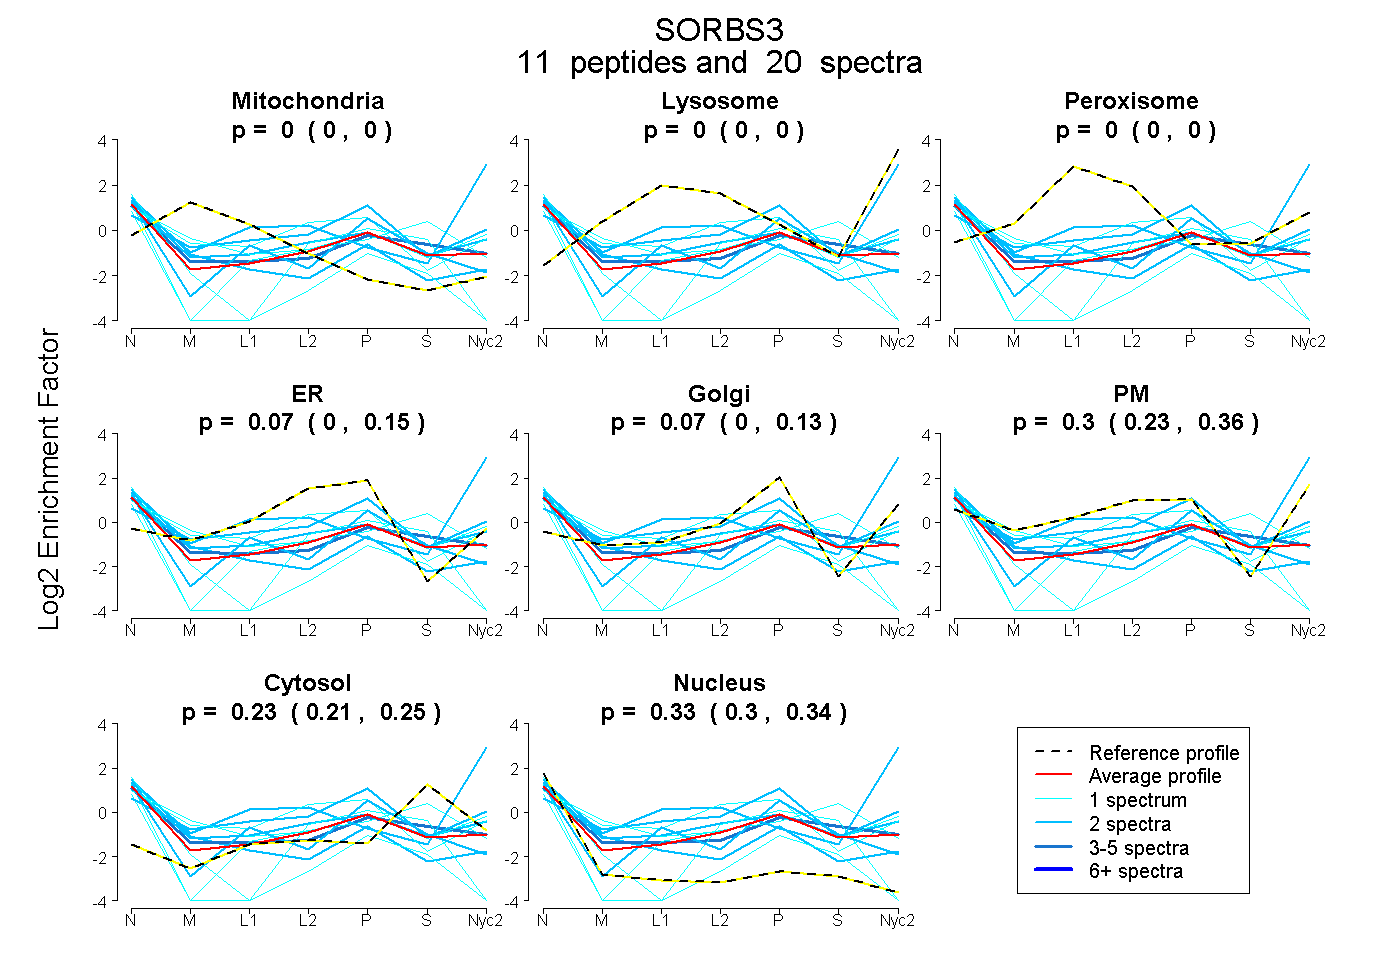
0.000 | 0.000
0.000 | 0.000
0.000 | 0.000
0.000 | 0.154
0.000 | 0.132
0.226 | 0.360
0.215 | 0.249
0.304 | 0.344
| Plot | Mito | Lyso | Perox | ER | Golgi | PM | Cytosol | Nucleus | |||||
| Expt A |
11 peptides |
20 spectra |
|
0.000 0.000 | 0.000 |
0.000 0.000 | 0.000 |
0.000 0.000 | 0.000 |
0.068 0.000 | 0.154 |
0.071 0.000 | 0.132 |
0.300 0.226 | 0.360 |
0.234 0.215 | 0.249 |
0.326 0.304 | 0.344 |
| 2 spectra, IPGVGR | 0.000 | 0.415 | 0.000 | 0.000 | 0.000 | 0.405 | 0.000 | 0.180 | ||
| 1 spectrum, RPLEQPGPEQQPSAR | 0.000 | 0.000 | 0.000 | 0.000 | 0.103 | 0.000 | 0.035 | 0.862 | ||
| 1 spectrum, LHASNQVPR | 0.006 | 0.000 | 0.049 | 0.279 | 0.000 | 0.412 | 0.053 | 0.201 | ||
| 1 spectrum, SAFPFPITLQEPR | 0.000 | 0.000 | 0.000 | 0.119 | 0.000 | 0.000 | 0.304 | 0.577 | ||
| 2 spectra, DFVYPSSAR | 0.128 | 0.000 | 0.000 | 0.000 | 0.224 | 0.135 | 0.000 | 0.513 | ||
| 1 spectrum, QGIFPASYVQINR | 0.102 | 0.000 | 0.000 | 0.000 | 0.004 | 0.509 | 0.193 | 0.192 | ||
| 2 spectra, AMYQYRPQNEDELELR | 0.000 | 0.000 | 0.002 | 0.000 | 0.000 | 0.524 | 0.222 | 0.252 | ||
| 2 spectra, NWNHSEETSR | 0.000 | 0.000 | 0.080 | 0.056 | 0.314 | 0.304 | 0.152 | 0.094 | ||
| 5 spectra, GDIVYIHK | 0.000 | 0.000 | 0.000 | 0.000 | 0.036 | 0.342 | 0.325 | 0.297 | ||
| 2 spectra, SQPQSLSTPGPTLSHPR | 0.000 | 0.000 | 0.000 | 0.243 | 0.144 | 0.000 | 0.251 | 0.363 | ||
| 1 spectrum, ICLIR | 0.000 | 0.000 | 0.000 | 0.151 | 0.000 | 0.013 | 0.629 | 0.208 |
| Plot | Lyso | Other | |||||||||||
| Expt C |
3 peptides |
8 spectra |
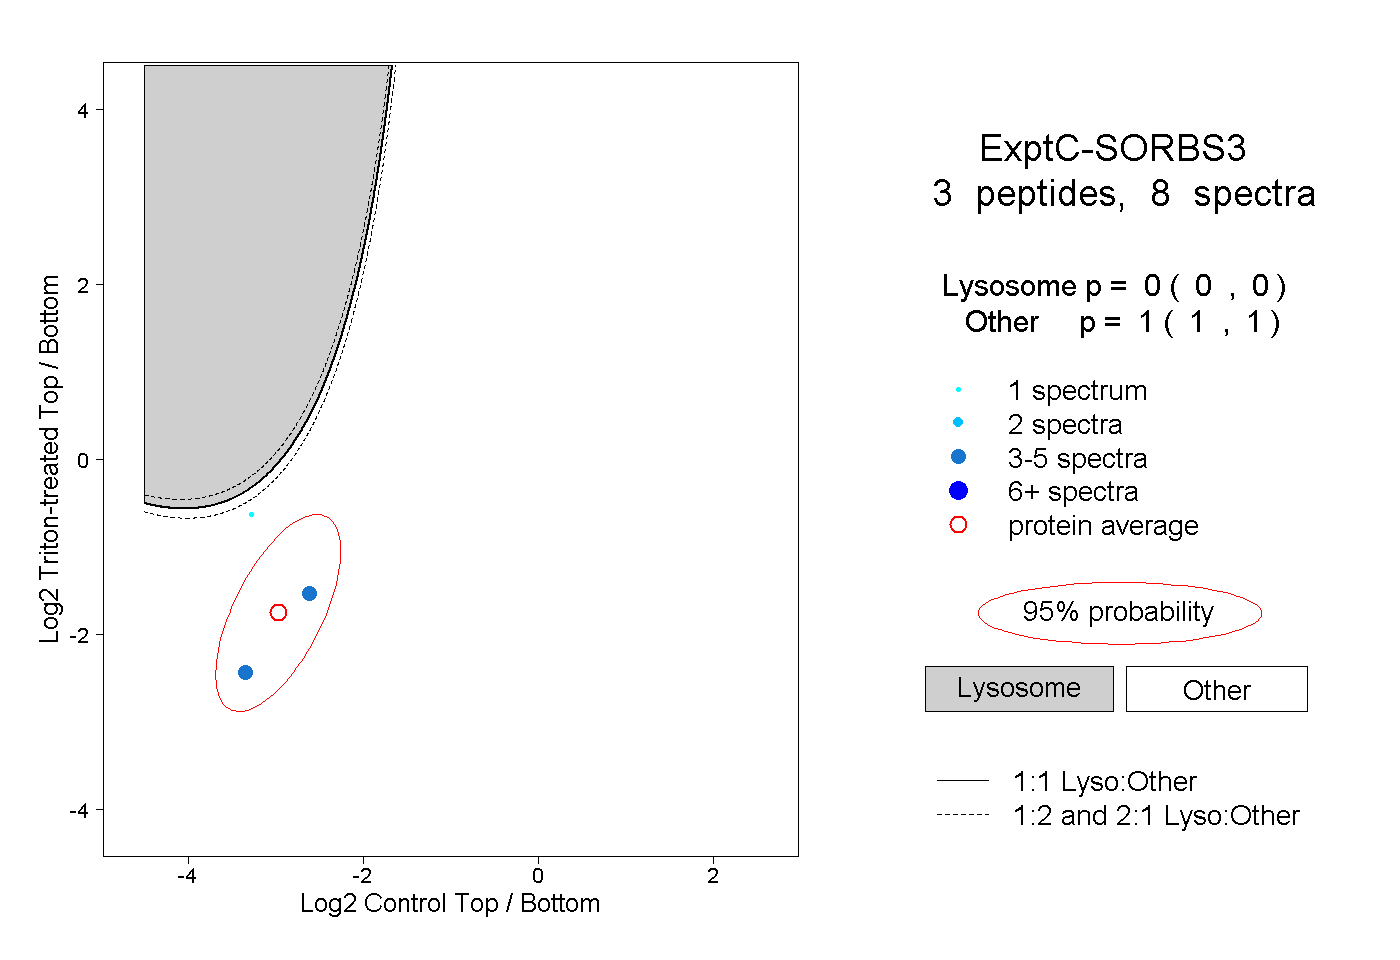 |
0.000 0.000 | 0.000 |
1.000 1.000 | 1.000 |