 7
7peptides
spectra
0.000 | 0.006
0.000 | 0.000
0.060 | 0.107
0.887 | 0.933
0.000 | 0.000
0.000 | 0.000
0.000 | 0.000
0.000 | 0.000
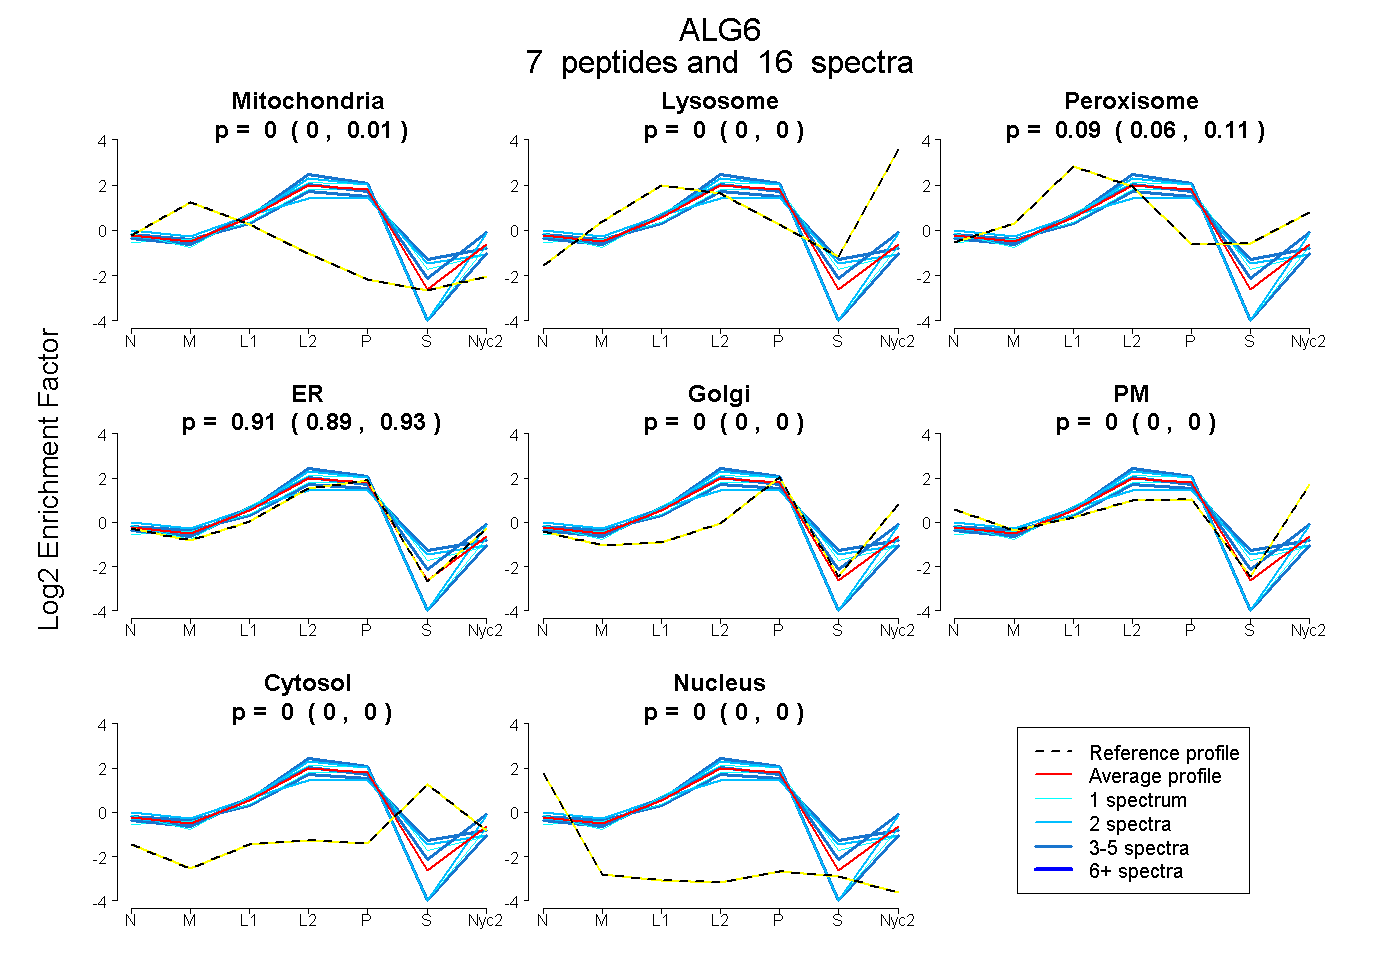
| Plot | Mito | Lyso | Perox | ER | Golgi | PM | Cytosol | Nucleus | |||||
| Expt A |
7 peptides |
16 spectra |
|
0.000 0.000 | 0.006 |
0.000 0.000 | 0.000 |
0.087 0.060 | 0.107 |
0.913 0.887 | 0.933 |
0.000 0.000 | 0.000 |
0.000 0.000 | 0.000 |
0.000 0.000 | 0.000 |
0.000 0.000 | 0.000 |
| 3 spectra, EHALQVVR | 0.000 | 0.000 | 0.173 | 0.736 | 0.000 | 0.000 | 0.091 | 0.000 | ||
| 2 spectra, SFAVSVR | 0.000 | 0.000 | 0.000 | 1.000 | 0.000 | 0.000 | 0.000 | 0.000 | ||
| 1 spectrum, LTVQPSAK | 0.000 | 0.000 | 0.000 | 1.000 | 0.000 | 0.000 | 0.000 | 0.000 | ||
| 3 spectra, LFPVDR | 0.000 | 0.000 | 0.000 | 1.000 | 0.000 | 0.000 | 0.000 | 0.000 | ||
| 1 spectrum, GSALFIR | 0.000 | 0.000 | 0.106 | 0.851 | 0.000 | 0.000 | 0.043 | 0.000 | ||
| 4 spectra, HLPGFTFLPR | 0.000 | 0.000 | 0.191 | 0.809 | 0.000 | 0.000 | 0.000 | 0.000 | ||
| 2 spectra, GYESQAHK | 0.069 | 0.000 | 0.181 | 0.700 | 0.000 | 0.000 | 0.049 | 0.000 |
| Plot | Mito | Lyso or Perox | ER | Golgi | PM | Cytosol | Nucleus | ||||||
| Expt B |
3 peptides |
4 spectra |
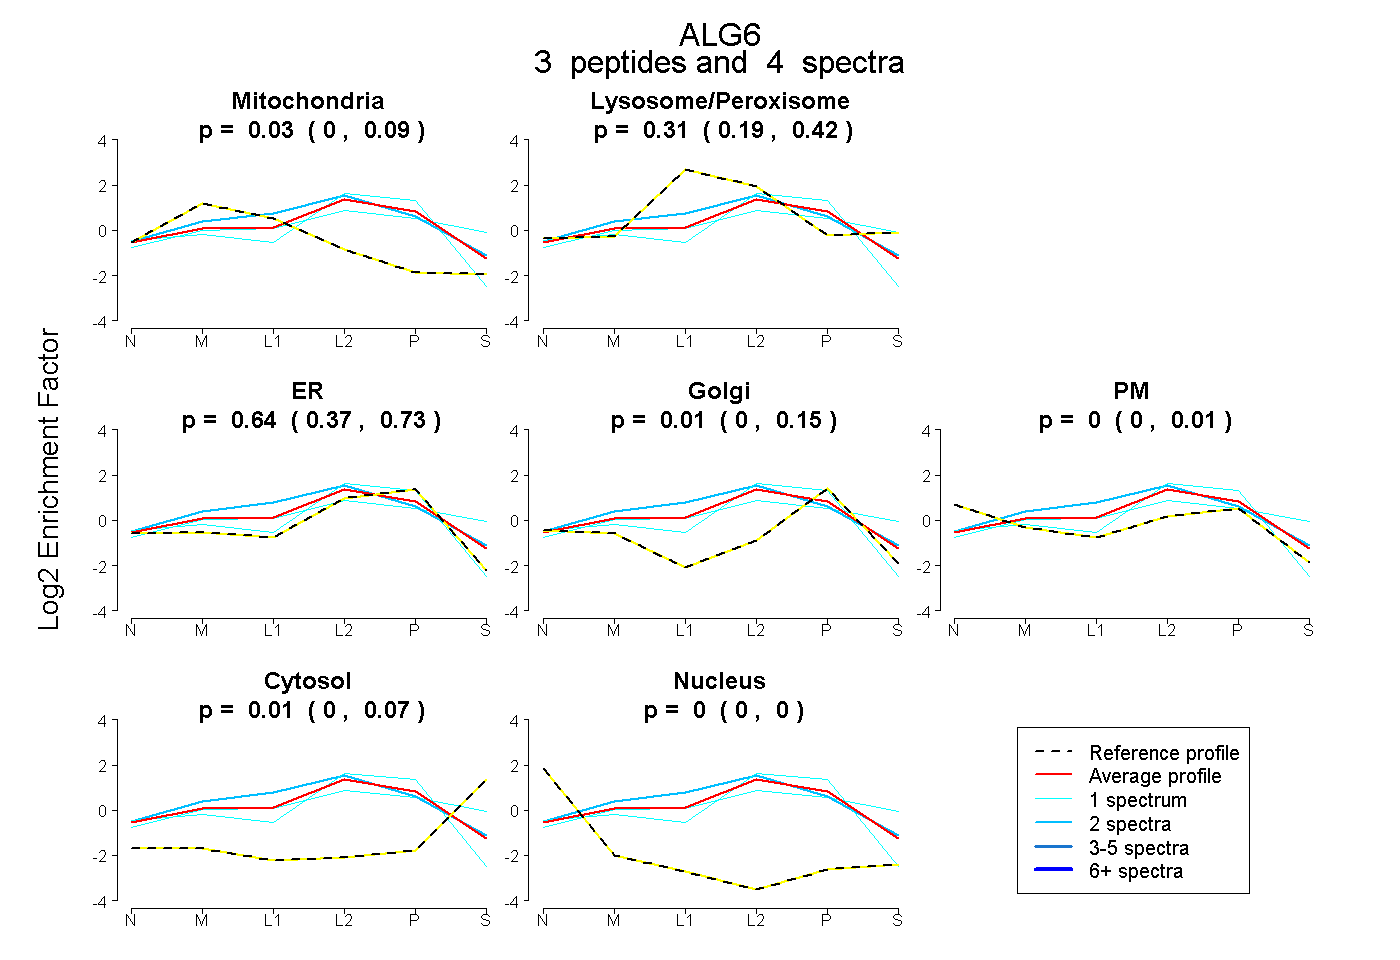 |
0.032 0.000 | 0.094 |
0.308 0.194 | 0.424 |
0.642 0.373 | 0.727 |
0.008 0.000 | 0.152 |
0.000 0.000 | 0.008 |
0.009 0.000 | 0.068 |
0.000 0.000 | 0.000 |
|||
| Plot | Lyso | Other | |||||||||||
| Expt C |
7 peptides |
25 spectra |
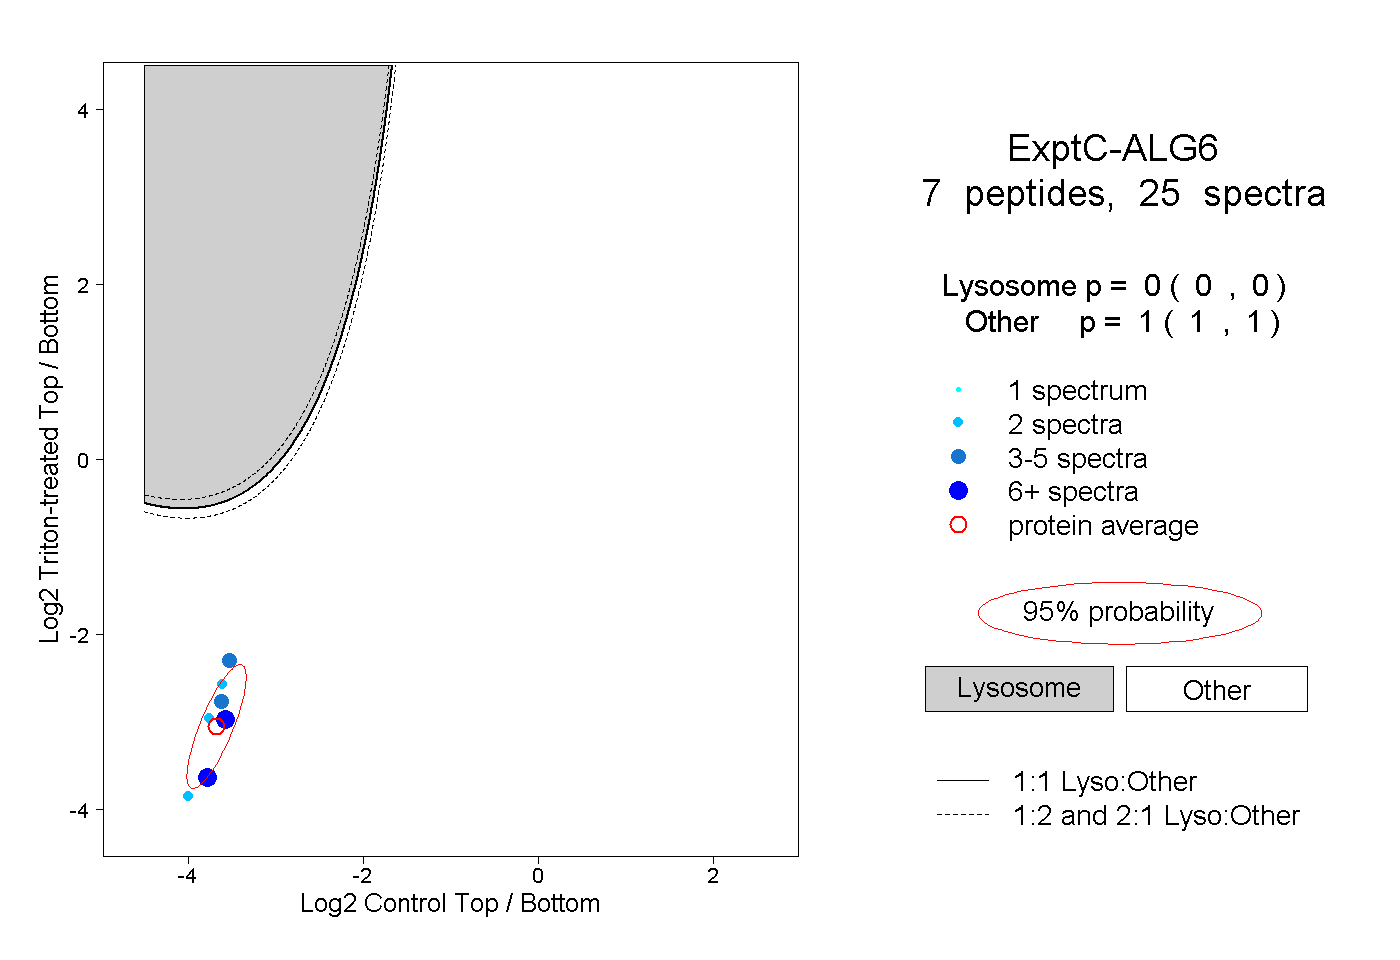 |
0.000 0.000 | 0.000 |
1.000 1.000 | 1.000 |
||||||||
| Plot | Lyso | Other | |||||||||||
| Expt D |
2 peptides |
4 spectra |
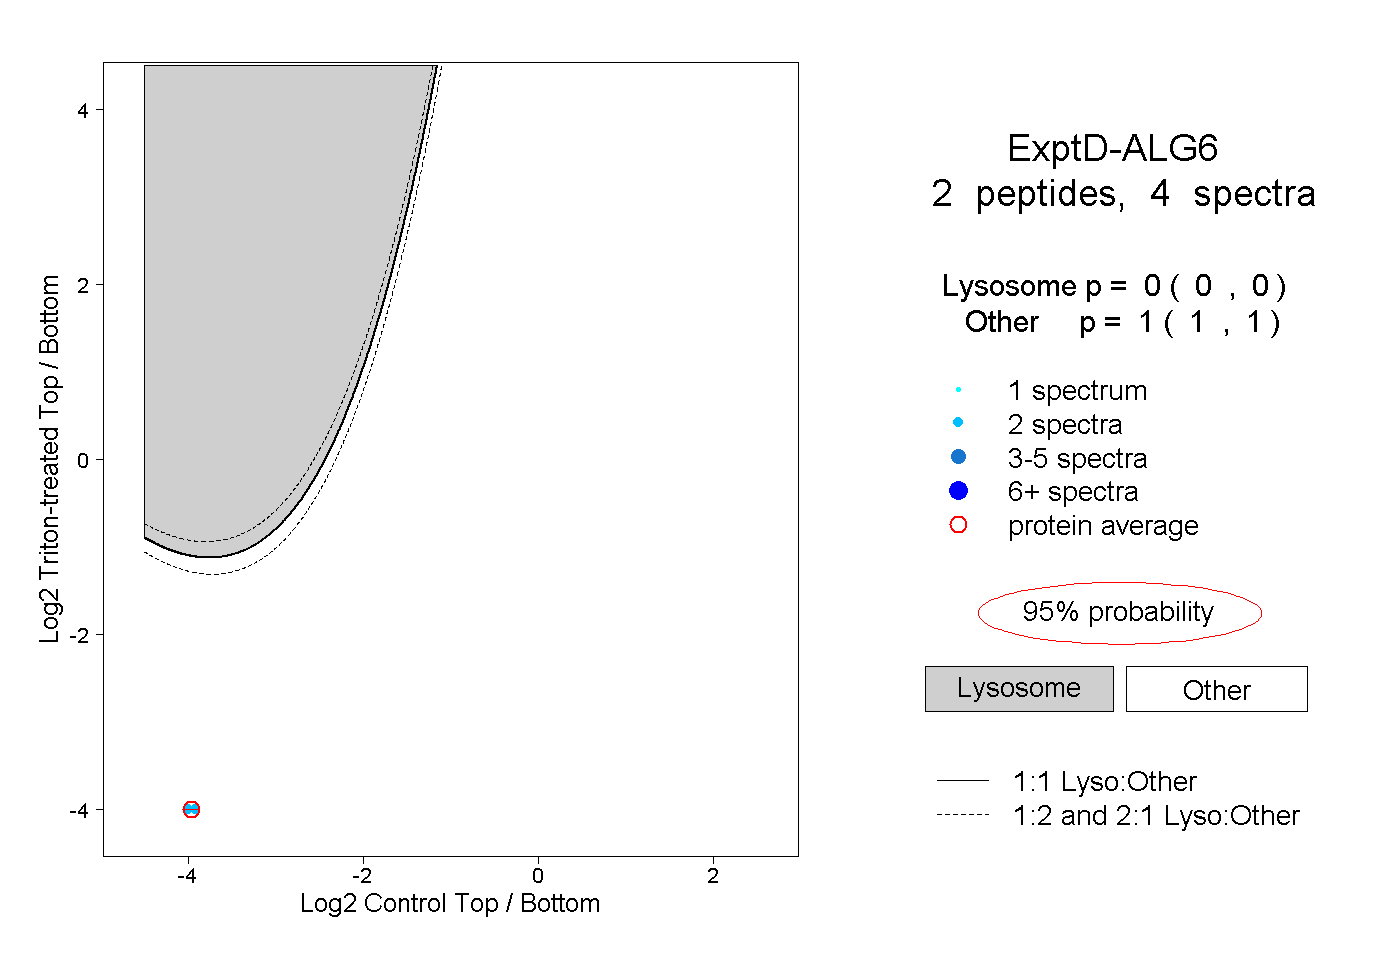 |
0.000 0.000 | 0.000 |
1.000 1.000 | 1.000 |