 3
3peptides
spectra
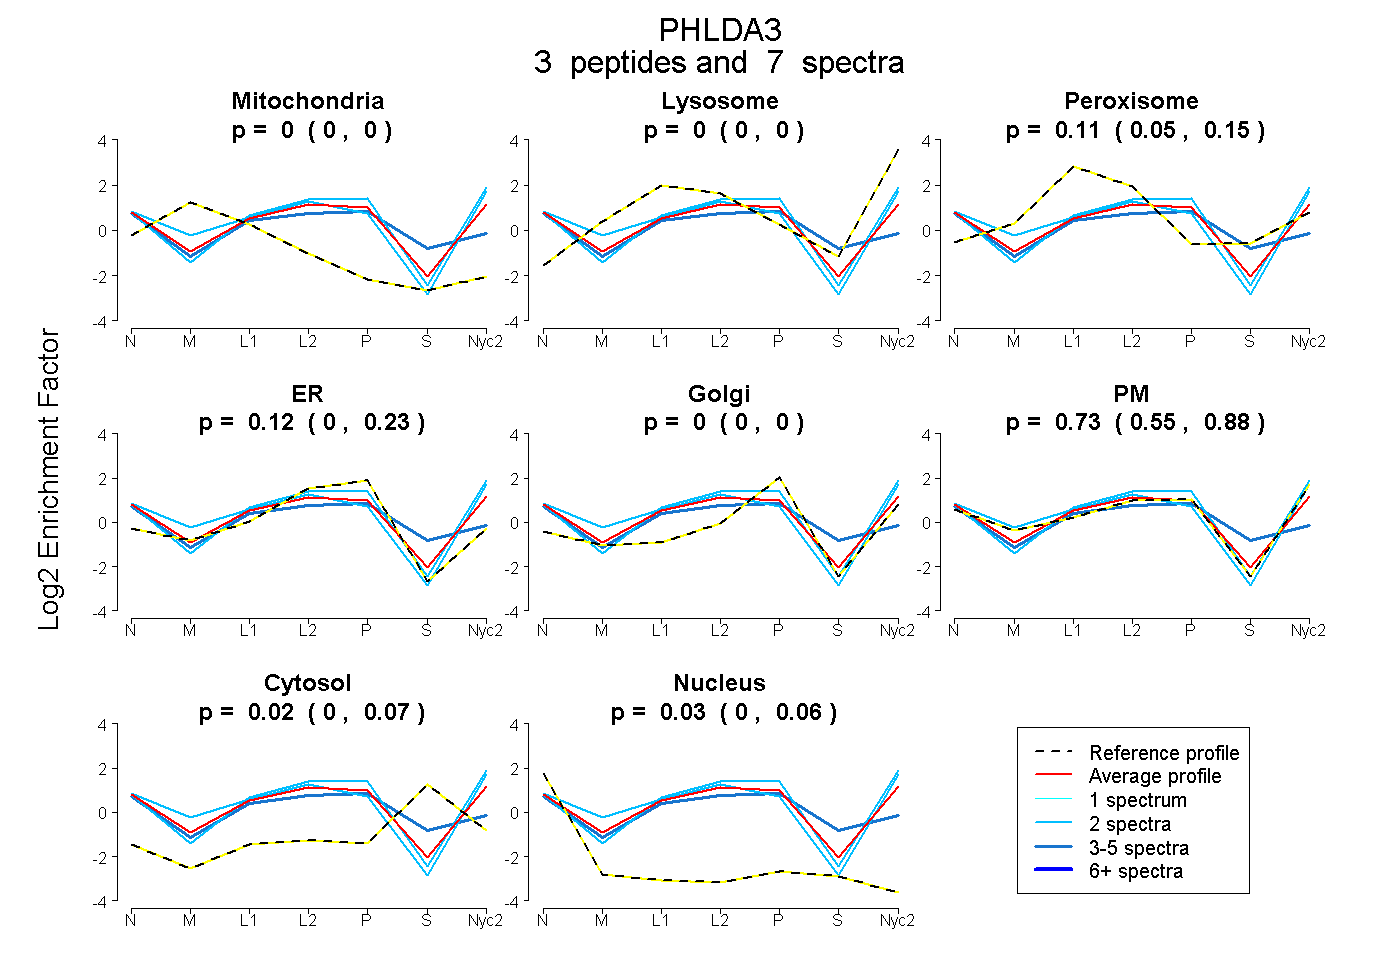
0.000 | 0.000
0.000 | 0.000
0.048 | 0.150
0.000 | 0.232
0.000 | 0.000
0.553 | 0.880
0.000 | 0.073
0.000 | 0.056
1peptide
spectrum
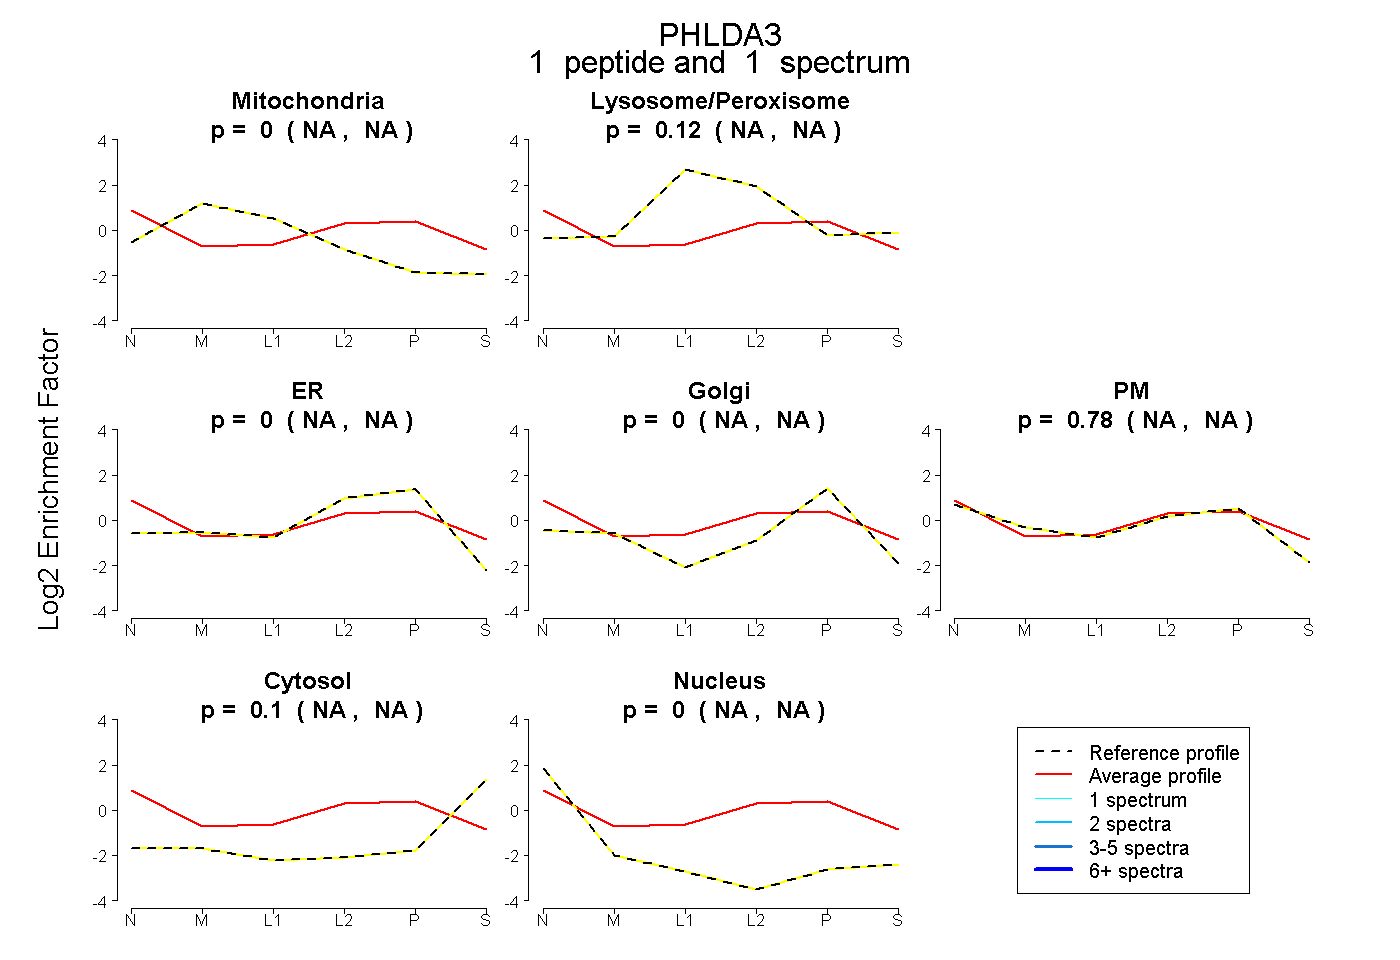
NA | NA
NA | NA
NA | NA
NA | NA
NA | NA
NA | NA
NA | NA
4peptides
spectra
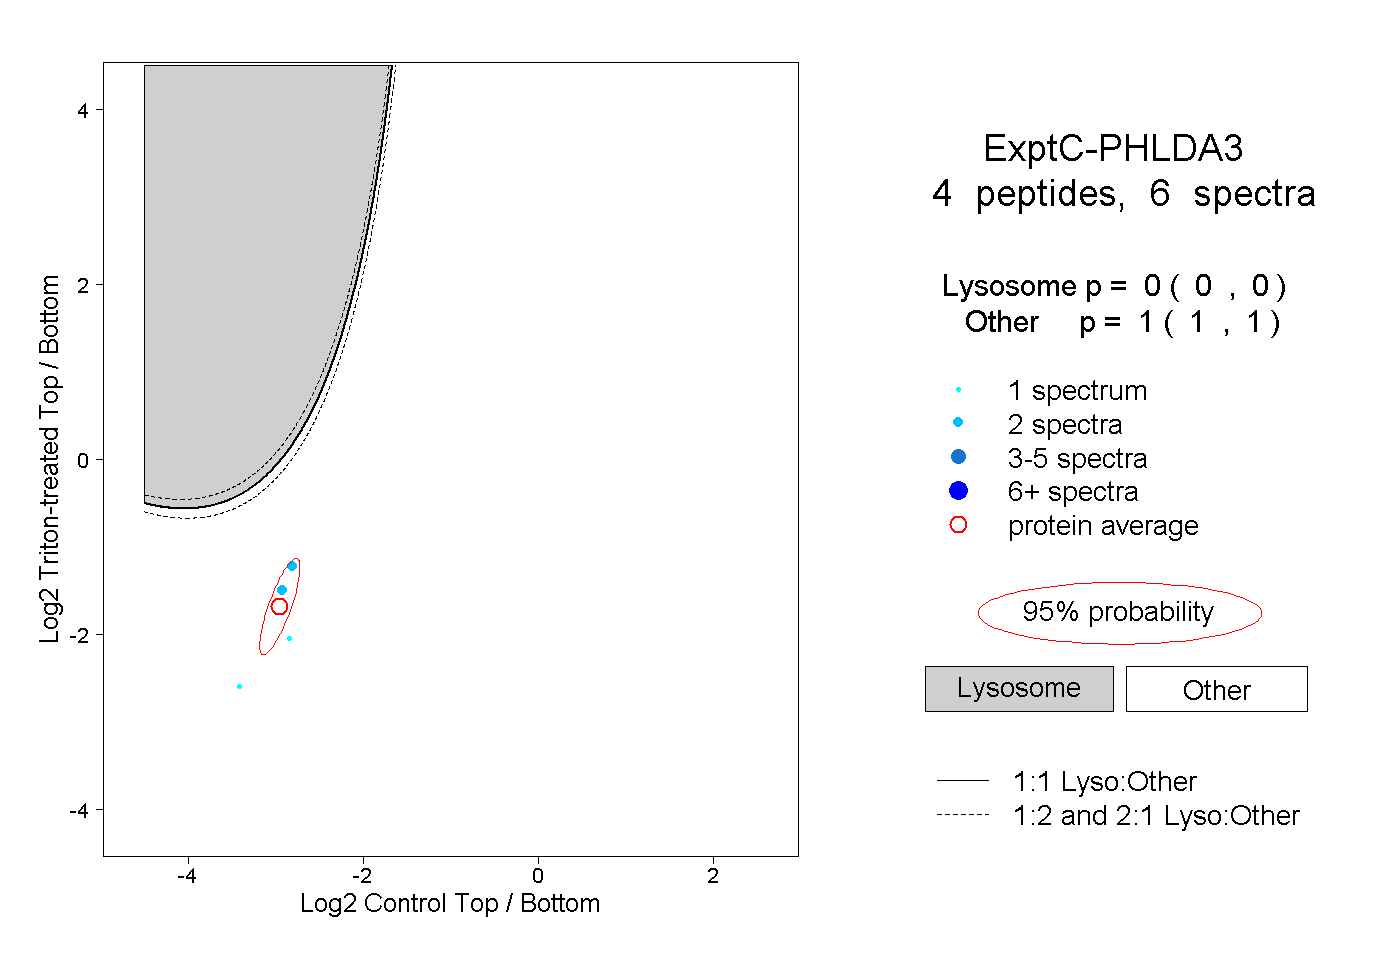
0.000 | 0.000
1.000 | 1.000
1peptide
spectra
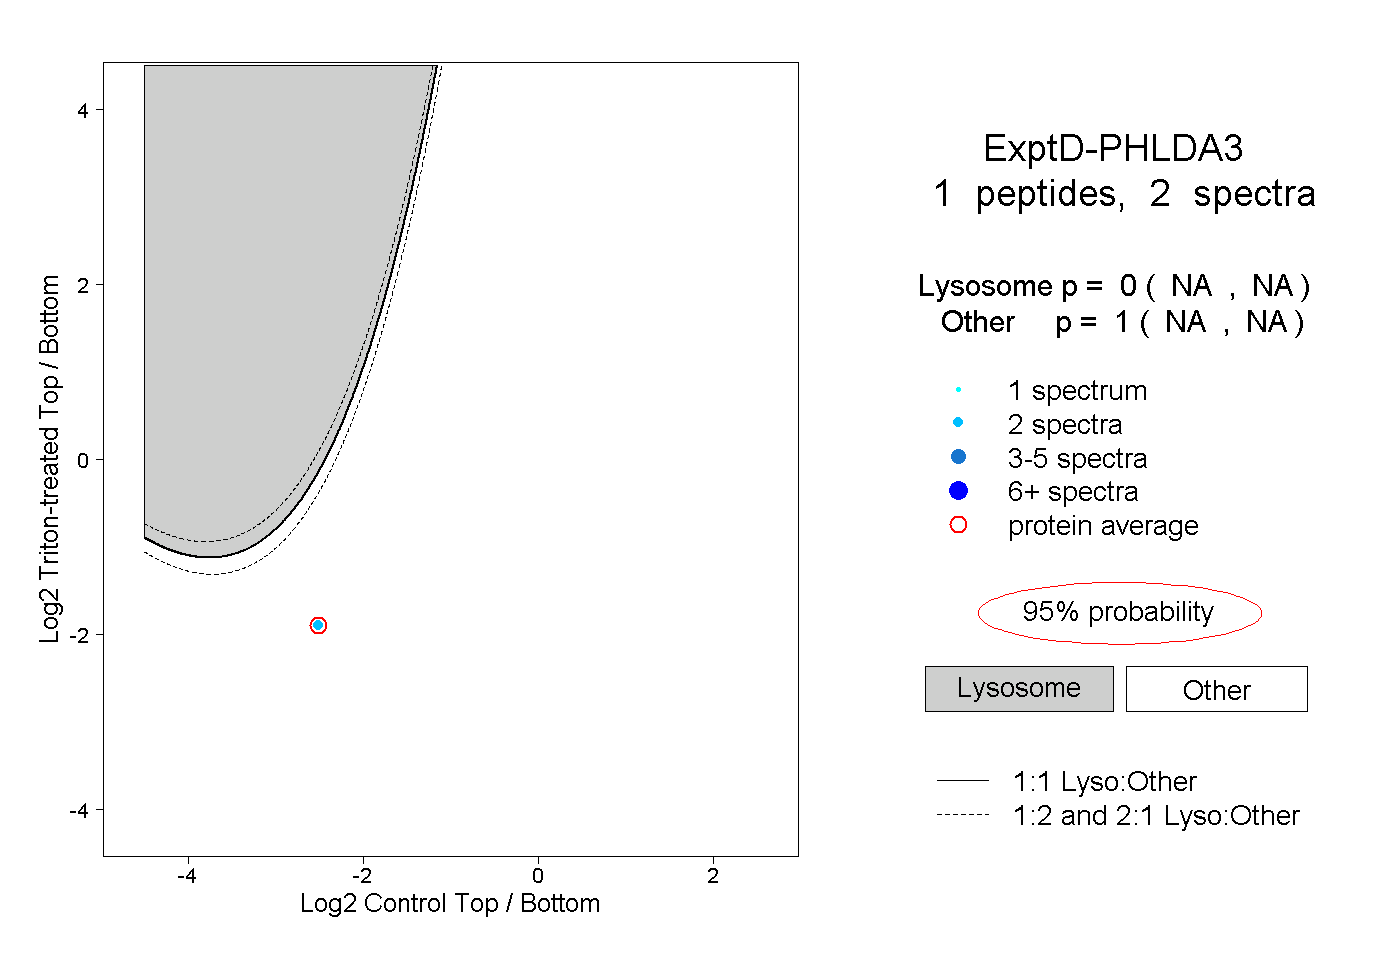
NA | NA
NA | NA