 3
3peptides
spectra
0.000 | 0.000
0.000 | 0.088
0.000 | 0.000
0.000 | 0.192
0.640 | 0.930
0.000 | 0.030
0.024 | 0.130
0.000 | 0.000
1peptide
spectra

NA | NA
NA | NA
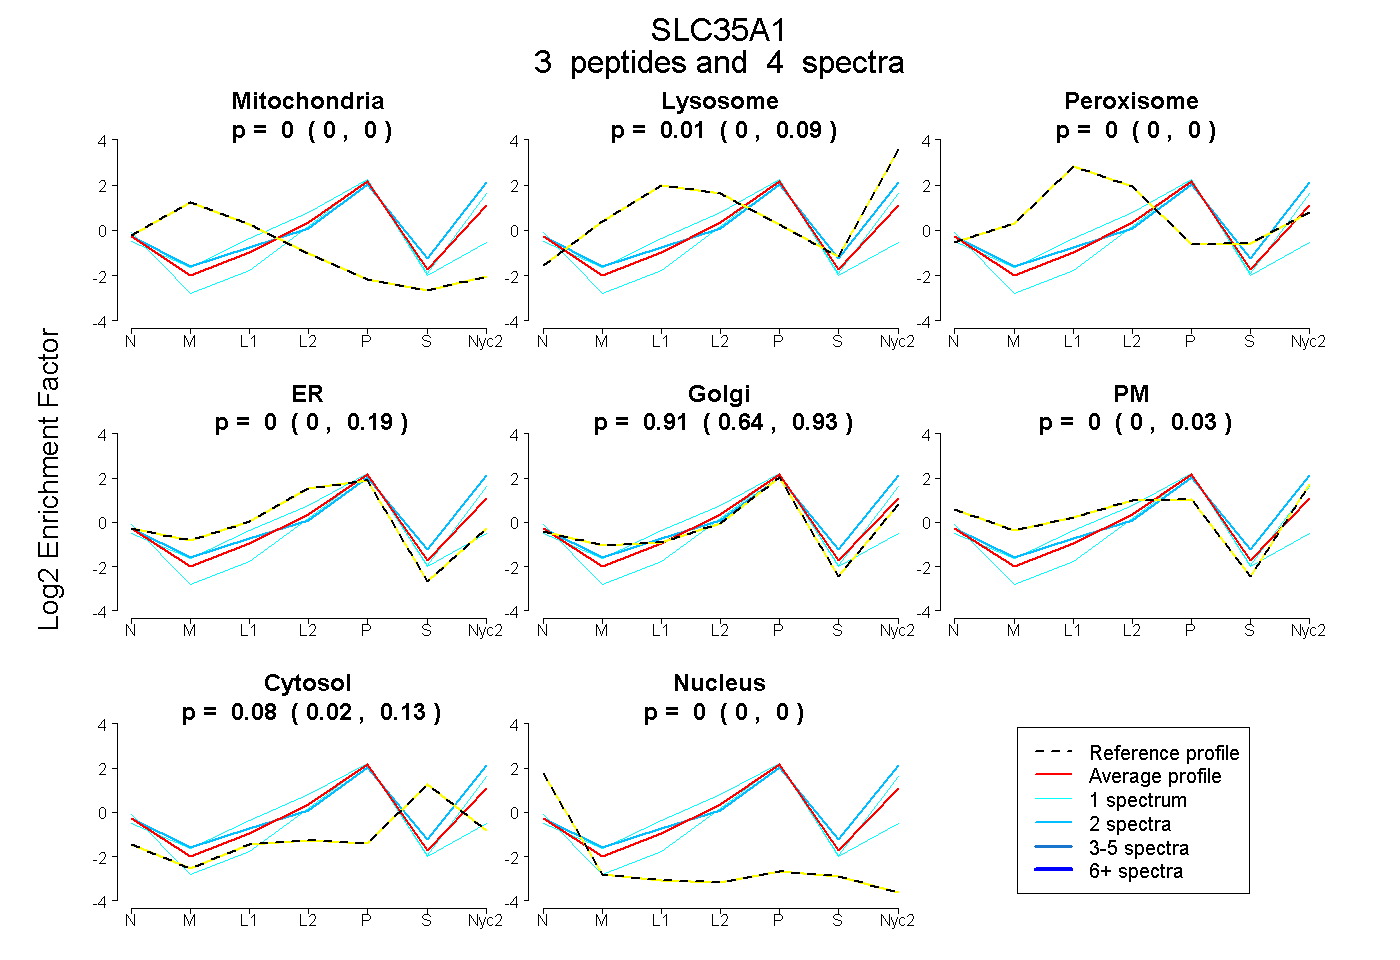
| Plot | Mito | Lyso | Perox | ER | Golgi | PM | Cytosol | Nucleus | |||||
| Expt A |
3 peptides |
4 spectra |
|
0.000 0.000 | 0.000 |
0.008 0.000 | 0.088 |
0.000 0.000 | 0.000 |
0.000 0.000 | 0.192 |
0.913 0.640 | 0.930 |
0.000 0.000 | 0.030 |
0.079 0.024 | 0.130 |
0.000 0.000 | 0.000 |
||
| Plot | Lyso | Other | |||||||||||
| Expt C |
1 peptide |
2 spectra |
|
0.000 NA | NA |
1.000 NA | NA |