15
15peptides
spectra
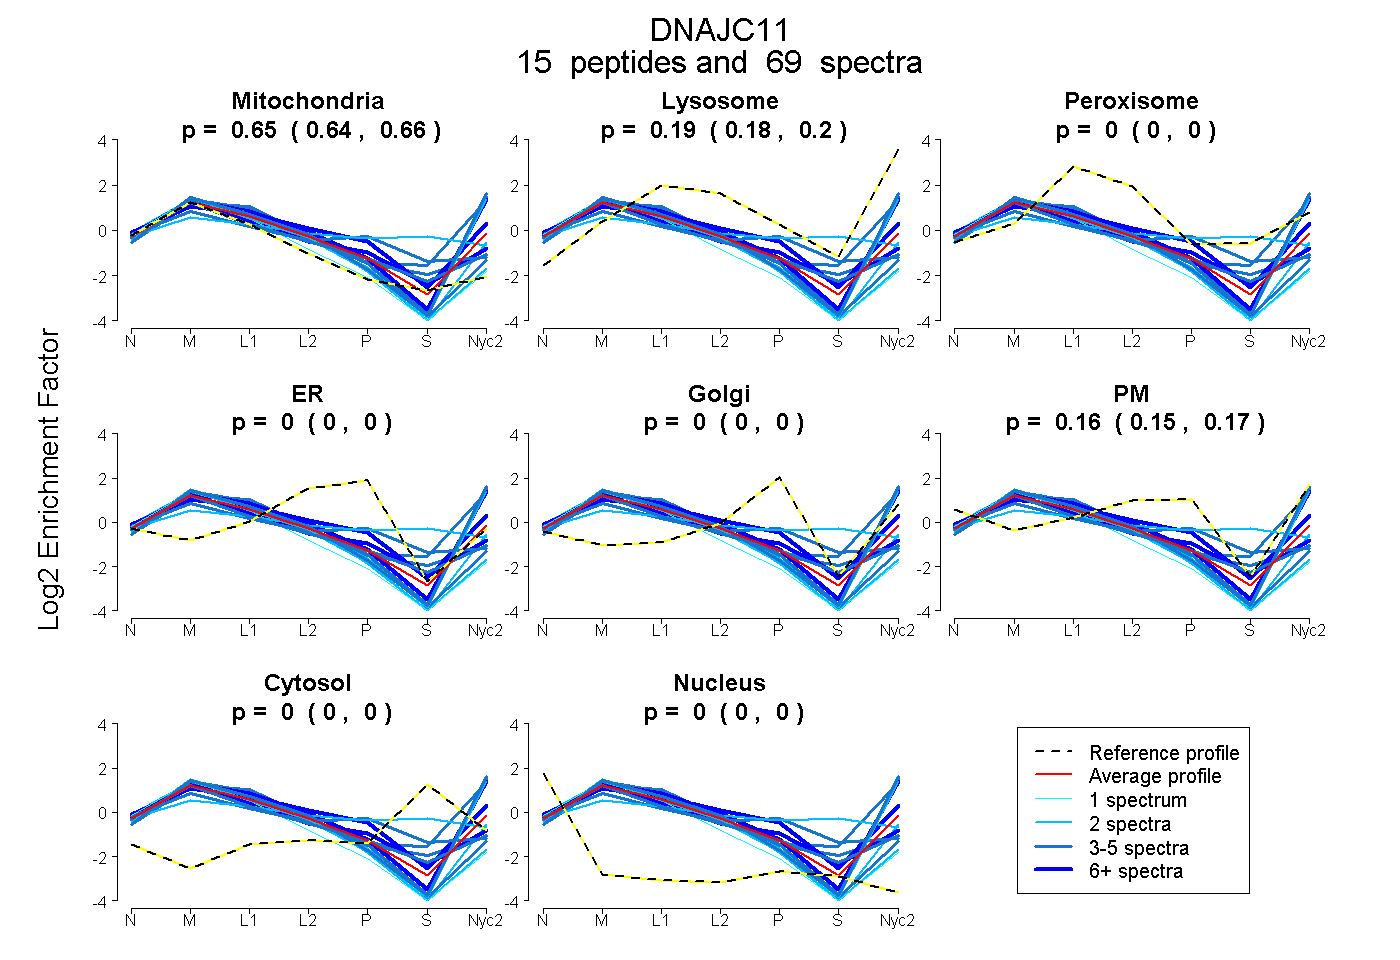
0.645 | 0.661
0.177 | 0.197
0.000 | 0.000
0.000 | 0.000
0.000 | 0.000
0.149 | 0.167
0.000 | 0.000
0.000 | 0.000
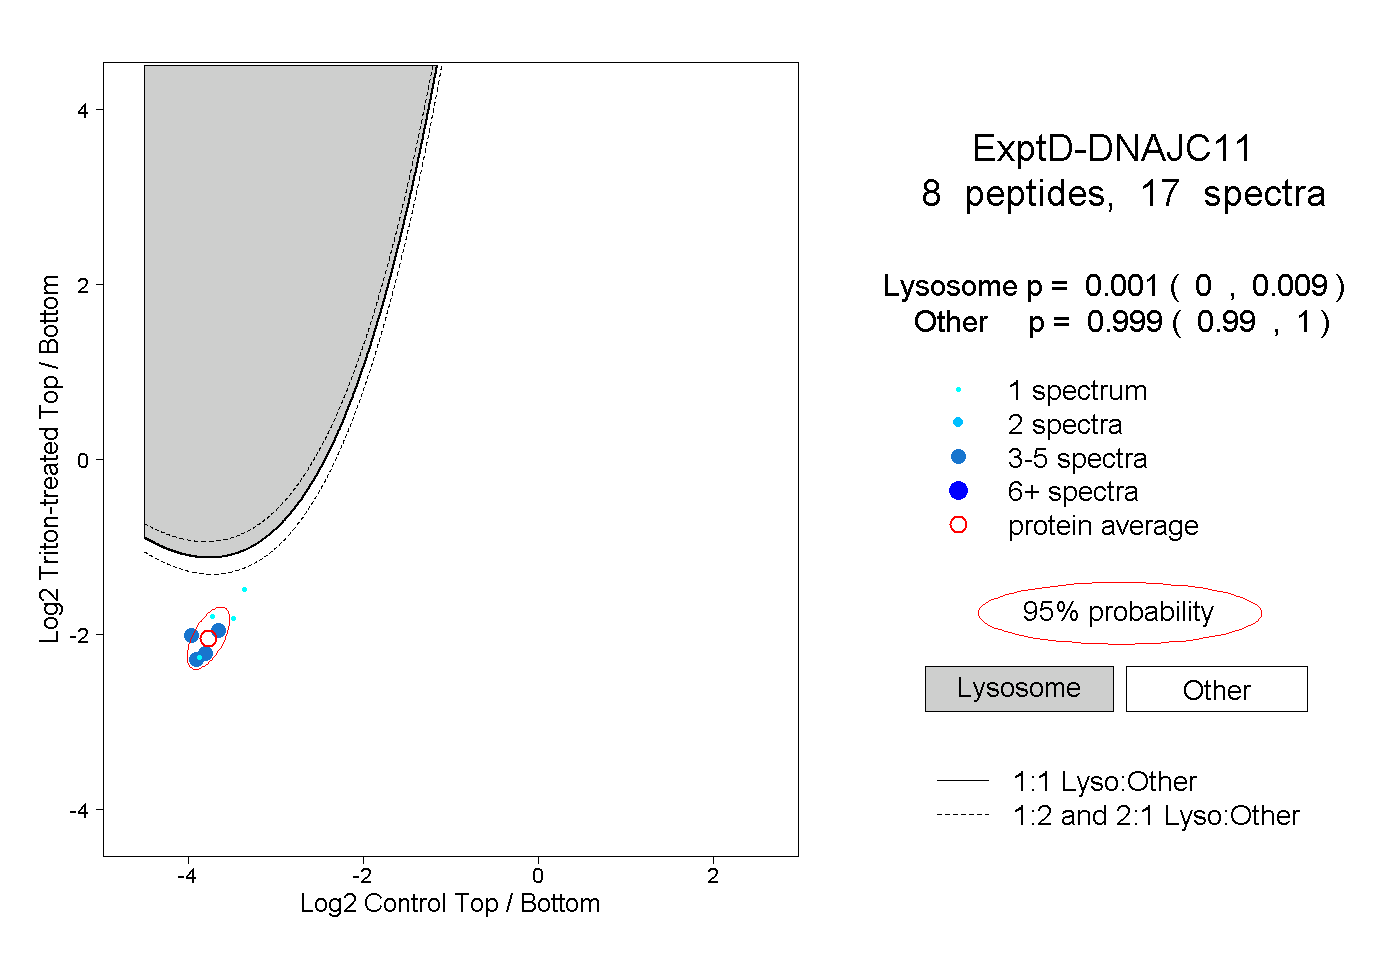
8peptides
spectra
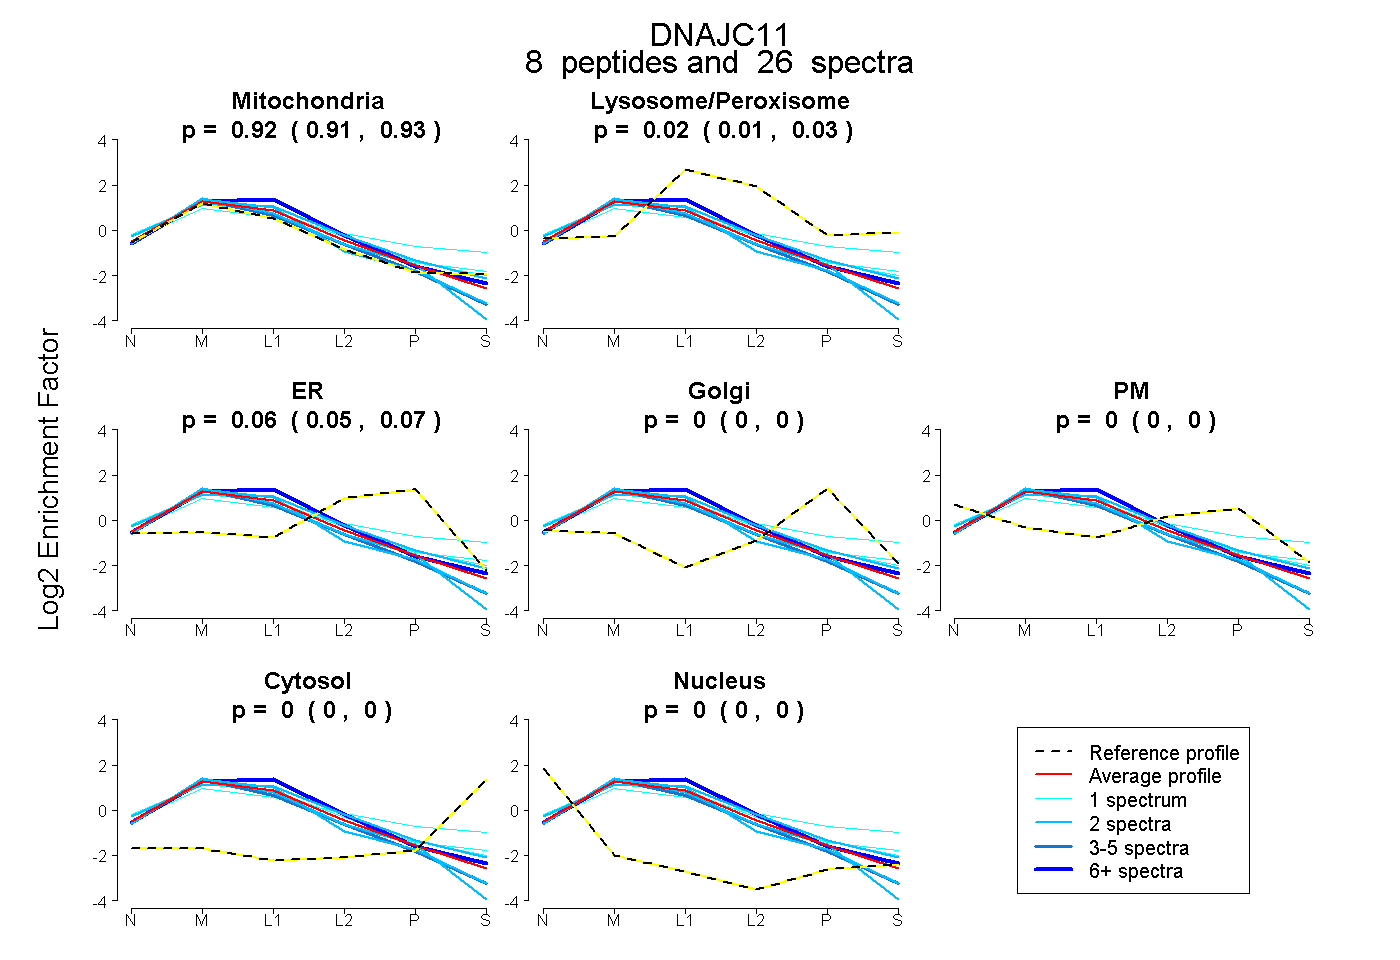
0.911 | 0.928
0.006 | 0.034
0.047 | 0.067
0.000 | 0.000
0.000 | 0.000
0.000 | 0.000
0.000 | 0.000