 15
15peptides
spectra
0.645 | 0.661
0.177 | 0.197
0.000 | 0.000
0.000 | 0.000
0.000 | 0.000
0.149 | 0.167
0.000 | 0.000
0.000 | 0.000
| Plot | Mito | Lyso | Perox | ER | Golgi | PM | Cytosol | Nucleus | |||||
| Expt A |
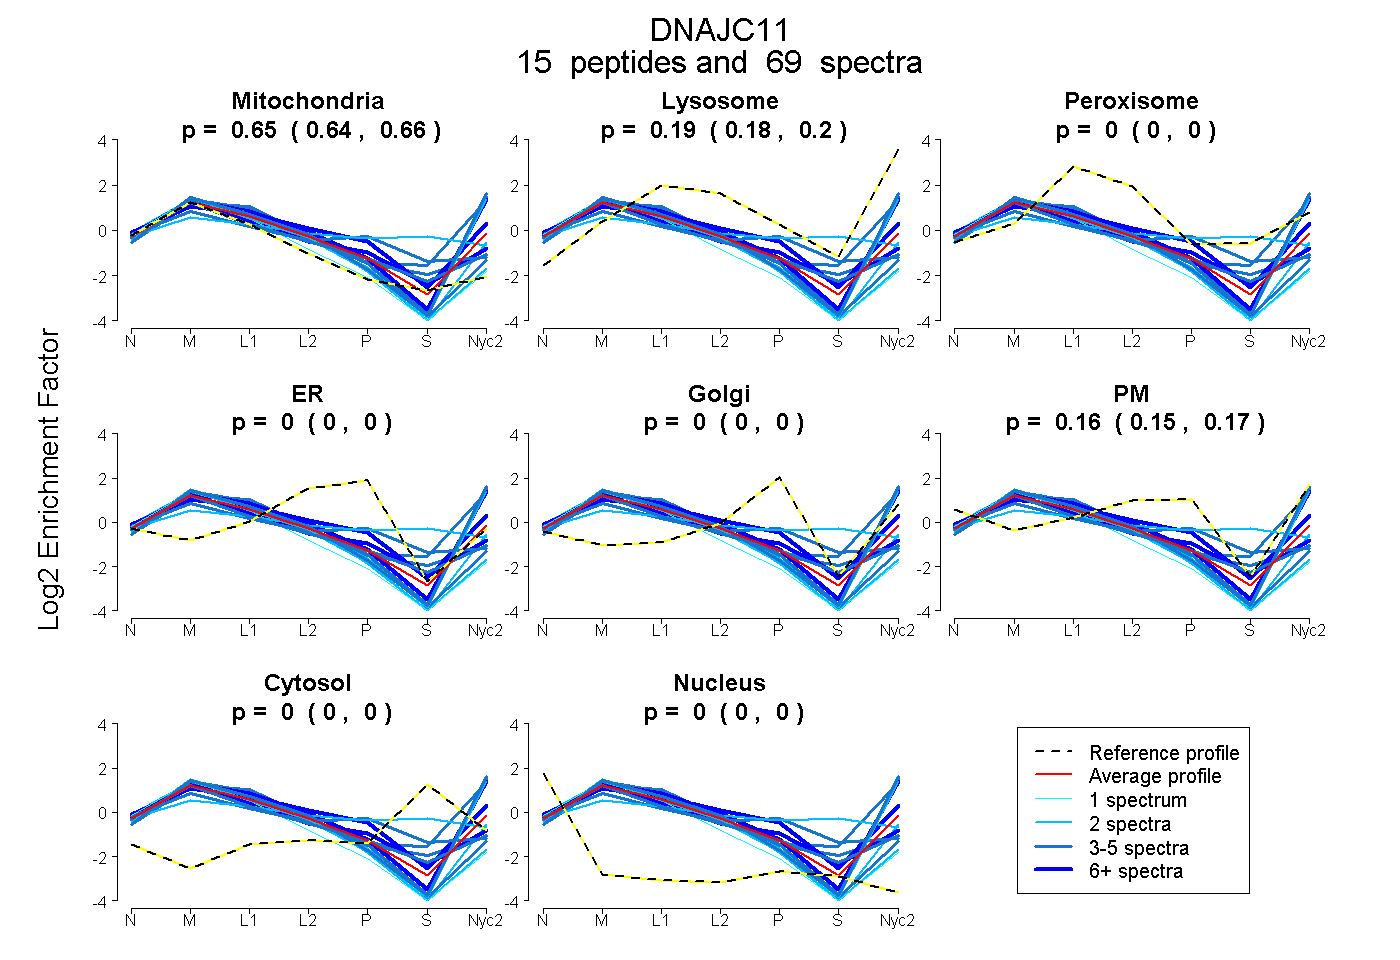
15 peptides |
69 spectra |
|
0.654 0.645 | 0.661 |
0.187 0.177 | 0.197 |
0.000 0.000 | 0.000 |
0.000 0.000 | 0.000 |
0.000 0.000 | 0.000 |
0.159 0.149 | 0.167 |
0.000 0.000 | 0.000 |
0.000 0.000 | 0.000 |
| 2 spectra, CFVTTNCALQFSSR | 0.870 | 0.022 | 0.000 | 0.108 | 0.000 | 0.000 | 0.000 | 0.000 | ||
| 10 spectra, GVLHQVMMPDSEALR | 0.483 | 0.193 | 0.000 | 0.000 | 0.000 | 0.324 | 0.000 | 0.000 | ||
| 1 spectrum, LILTEASK | 0.968 | 0.000 | 0.000 | 0.003 | 0.000 | 0.029 | 0.000 | 0.000 | ||
| 4 spectra, FQDDDQTR | 0.450 | 0.490 | 0.000 | 0.000 | 0.000 | 0.000 | 0.019 | 0.040 | ||
| 4 spectra, WGIQSAMNTSIVR | 0.531 | 0.395 | 0.000 | 0.000 | 0.000 | 0.075 | 0.000 | 0.000 | ||
| 2 spectra, LMQESVR | 0.307 | 0.000 | 0.315 | 0.000 | 0.140 | 0.000 | 0.237 | 0.000 | ||
| 4 spectra, AIYDIYGK | 0.684 | 0.009 | 0.284 | 0.000 | 0.000 | 0.023 | 0.000 | 0.000 | ||
| 4 spectra, VLYQFR | 0.753 | 0.101 | 0.010 | 0.011 | 0.064 | 0.061 | 0.000 | 0.000 | ||
| 3 spectra, LCMLYHPDK | 0.520 | 0.000 | 0.135 | 0.067 | 0.191 | 0.000 | 0.087 | 0.000 | ||
| 2 spectra, ENTASDILQK | 0.753 | 0.021 | 0.000 | 0.000 | 0.000 | 0.225 | 0.000 | 0.000 | ||
| 17 spectra, GIRPGLTTVLAR | 0.479 | 0.324 | 0.000 | 0.000 | 0.000 | 0.196 | 0.000 | 0.000 | ||
| 5 spectra, AGFFGTIVEYGAER | 0.516 | 0.367 | 0.000 | 0.000 | 0.000 | 0.117 | 0.000 | 0.000 | ||
| 3 spectra, GLEMEGWEVVER | 0.803 | 0.036 | 0.000 | 0.103 | 0.000 | 0.057 | 0.000 | 0.000 | ||
| 2 spectra, NTVGYLQWR | 0.552 | 0.325 | 0.000 | 0.000 | 0.000 | 0.124 | 0.000 | 0.000 | ||
| 6 spectra, IIEAEESR | 0.697 | 0.090 | 0.000 | 0.000 | 0.048 | 0.165 | 0.000 | 0.000 |
| Plot | Mito | Lyso or Perox | ER | Golgi | PM | Cytosol | Nucleus | ||||||
| Expt B |
8 peptides |
26 spectra |
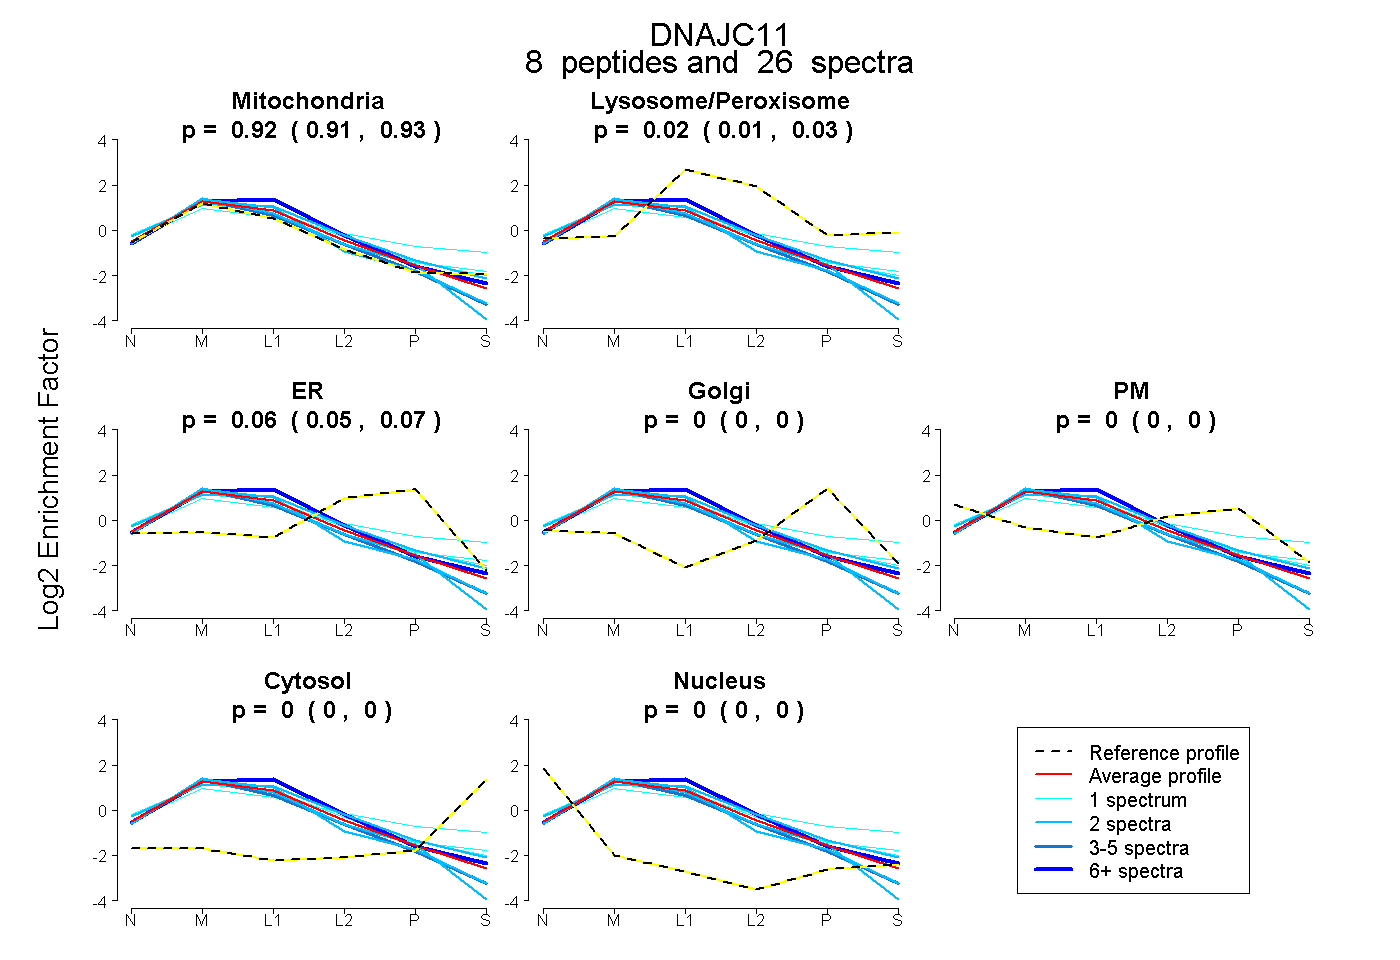 |
0.920 0.911 | 0.928 |
0.022 0.006 | 0.034 |
0.057 0.047 | 0.067 |
0.000 0.000 | 0.000 |
0.000 0.000 | 0.000 |
0.000 0.000 | 0.000 |
0.000 0.000 | 0.000 |
|||
| Plot | Lyso | Other | |||||||||||
| Expt C |
20 peptides |
181 spectra |
 |
0.000 0.000 | 0.000 |
1.000 1.000 | 1.000 |
||||||||
| Plot | Lyso | Other | |||||||||||
| Expt D |
8 peptides |
17 spectra |
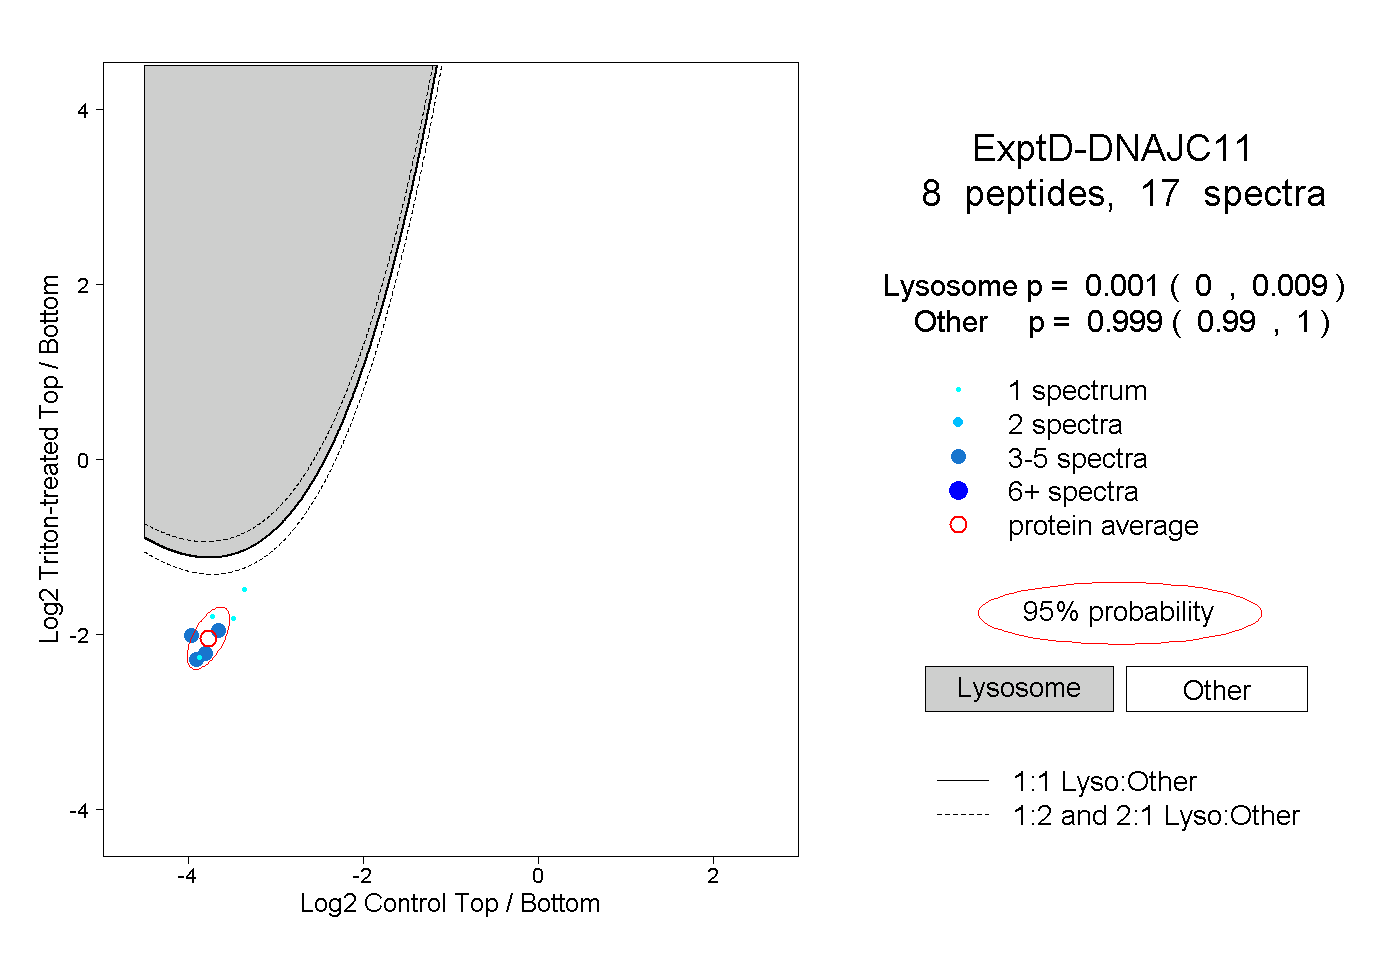 |
0.001 0.000 | 0.009 |
0.999 0.990 | 1.000 |