 14
14peptides
spectra
0.000 | 0.000
0.000 | 0.000
0.000 | 0.000
0.151 | 0.247
0.039 | 0.118
0.000 | 0.047
0.420 | 0.433
0.260 | 0.281
1peptide
spectrum
NA | NA
NA | NA
NA | NA
NA | NA
NA | NA
NA | NA
NA | NA
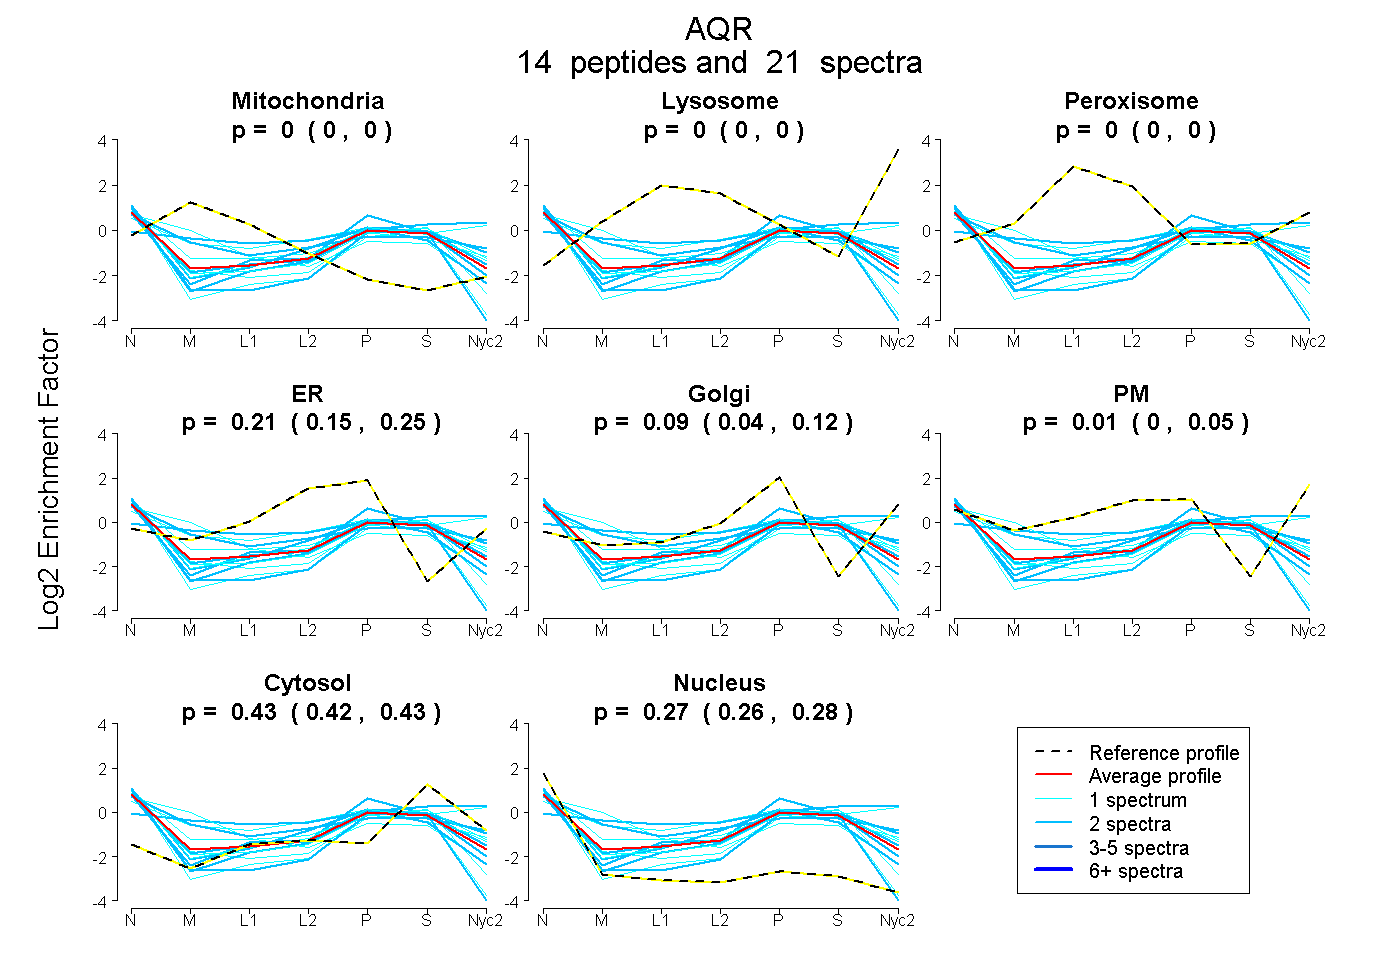
| Plot | Mito | Lyso | Perox | ER | Golgi | PM | Cytosol | Nucleus | |||||
| Expt A |
14 peptides |
21 spectra |
|
0.000 0.000 | 0.000 |
0.000 0.000 | 0.000 |
0.000 0.000 | 0.000 |
0.205 0.151 | 0.247 |
0.087 0.039 | 0.118 |
0.011 0.000 | 0.047 |
0.427 0.420 | 0.433 |
0.271 0.260 | 0.281 |
||
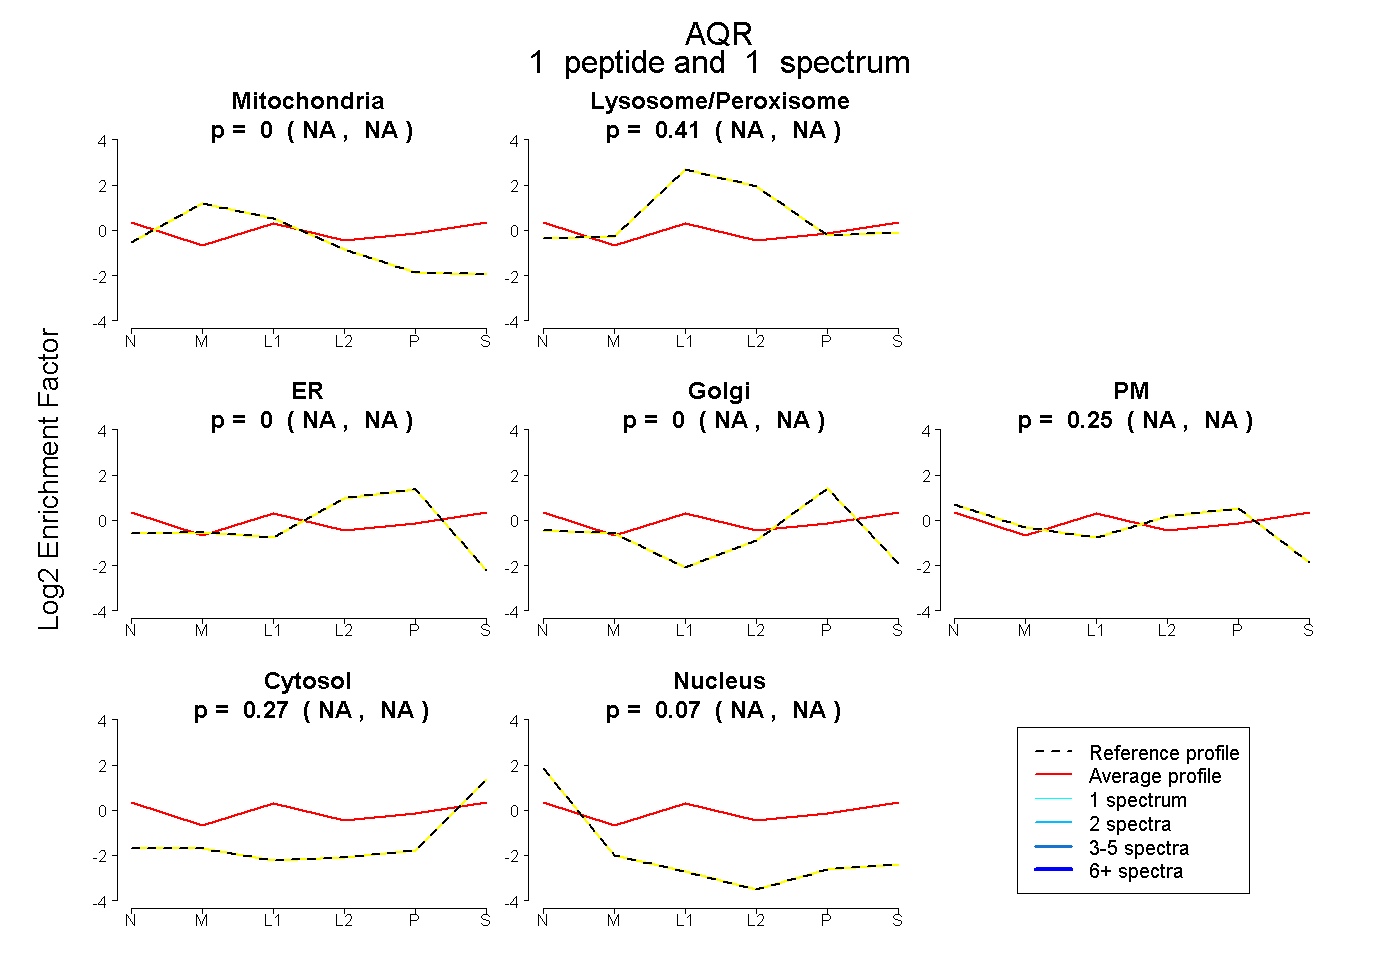
| Plot | Mito | Lyso or Perox | ER | Golgi | PM | Cytosol | Nucleus | ||||||
| Expt B |
1 peptide |
1 spectrum |
|
0.000 NA | NA |
0.407 NA | NA |
0.000 NA | NA |
0.000 NA | NA |
0.249 NA | NA |
0.273 NA | NA |
0.072 NA | NA |