ARPC4
[ENSRNOP00000011937]
Main page
| | | Plot |
Mito |
Lyso |
|
Perox |
ER |
Golgi |
PM |
Cytosol |
Nucleus |
|
| Expt A |
 9
9
peptides |
39
spectra |
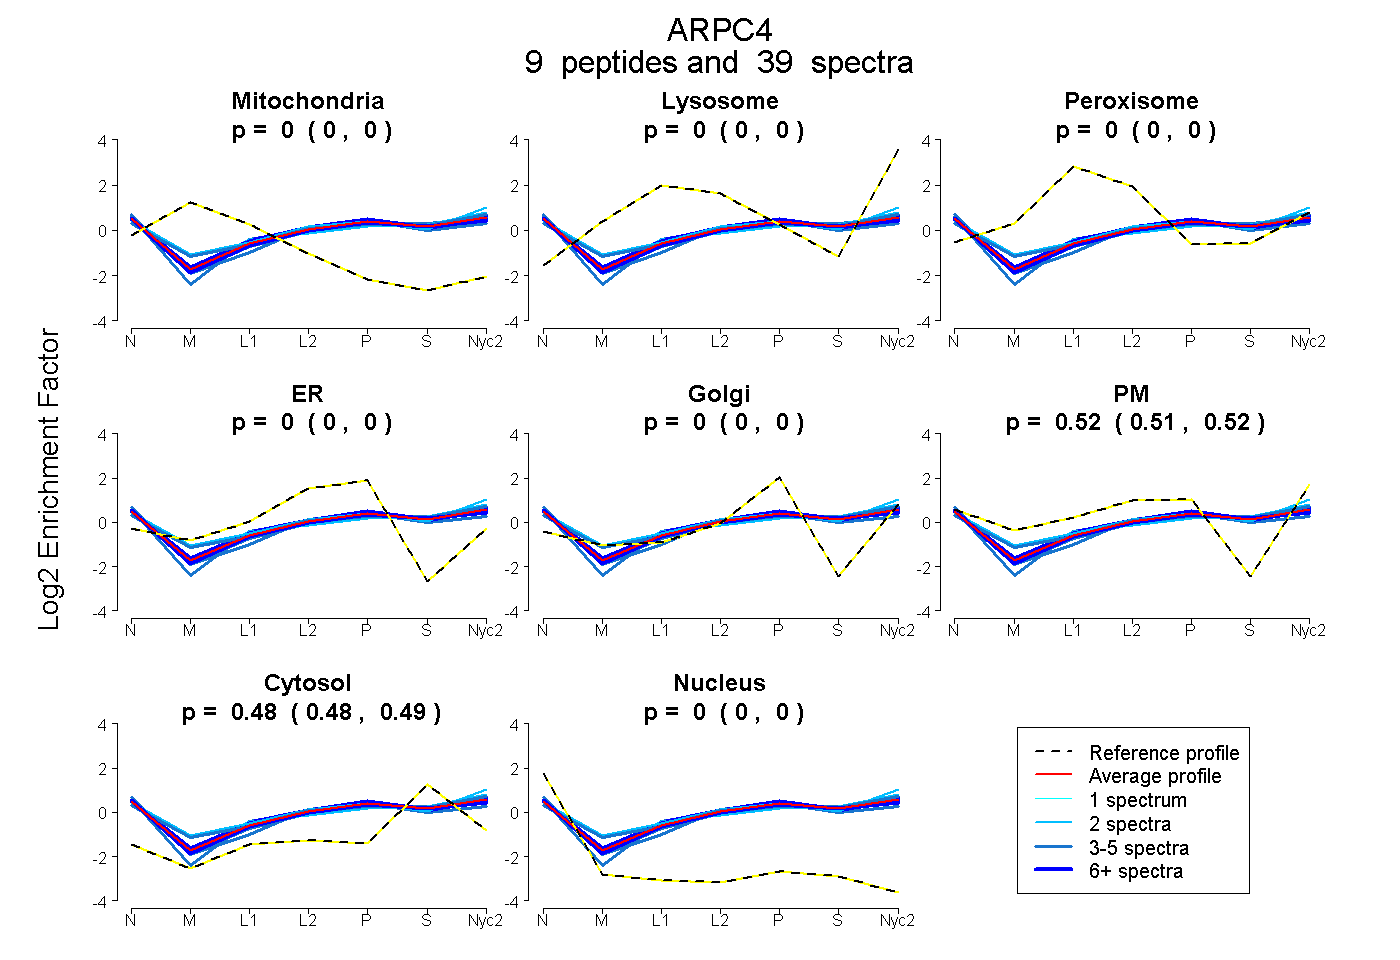 |
0.000
0.000 | 0.000 |
0.000
0.000 | 0.000 |
|
0.000
0.000 | 0.000 |
0.000
0.000 | 0.000 |
0.000
0.000 | 0.000 |
0.516
0.514 | 0.519 |
0.484
0.481 | 0.486 |
0.000
0.000 | 0.000 |
|
| | | Plot |
Mito |
|
Lyso or Perox |
|
ER |
Golgi |
PM |
Cytosol |
Nucleus |
|
| Expt B |
6
peptides |
33
spectra |
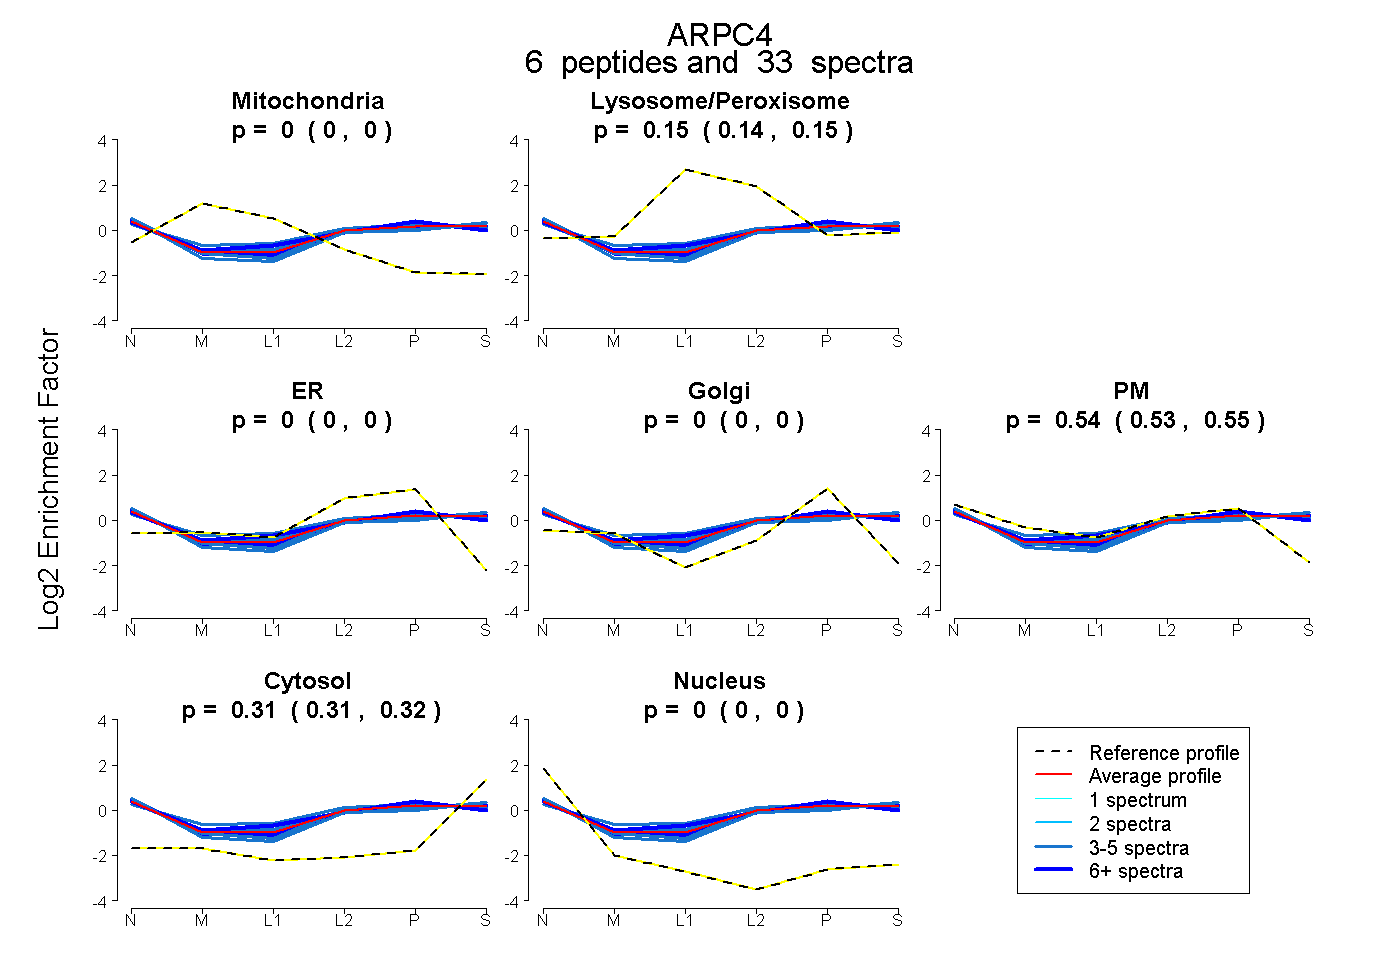 |
0.000
0.000 | 0.000 |
|
0.146
0.137 | 0.153 |
|
0.000
0.000 | 0.000 |
0.000
0.000 | 0.000 |
0.542
0.535 | 0.548 |
0.312
0.308 | 0.315 |
0.000
0.000 | 0.000 |
|
| 5 spectra, ELLLQPVTISR |
0.000 |
|
0.191 |
|
0.000 |
0.000 |
0.472 |
0.337 |
0.000 |
|
| 7 spectra, AENFFILR |
0.000 |
|
0.118 |
|
0.000 |
0.000 |
0.561 |
0.321 |
0.000 |
|
| 8 spectra, TATLRPYLSAVR |
0.000 |
|
0.187 |
|
0.000 |
0.042 |
0.509 |
0.262 |
0.000 |
|
| 5 spectra, IVAEEFLK |
0.000 |
|
0.087 |
|
0.000 |
0.000 |
0.614 |
0.299 |
0.000 |
|
| 4 spectra, VLIEGSINSVR |
0.000 |
|
0.079 |
|
0.000 |
0.000 |
0.550 |
0.371 |
0.000 |
|
| 4 spectra, HNKPEVEVR |
0.000 |
|
0.228 |
|
0.000 |
0.004 |
0.494 |
0.274 |
0.000 |
|
| | | Plot |
|
Lyso |
|
|
|
|
|
|
|
Other |
| Expt C |
9
peptides |
64
spectra |
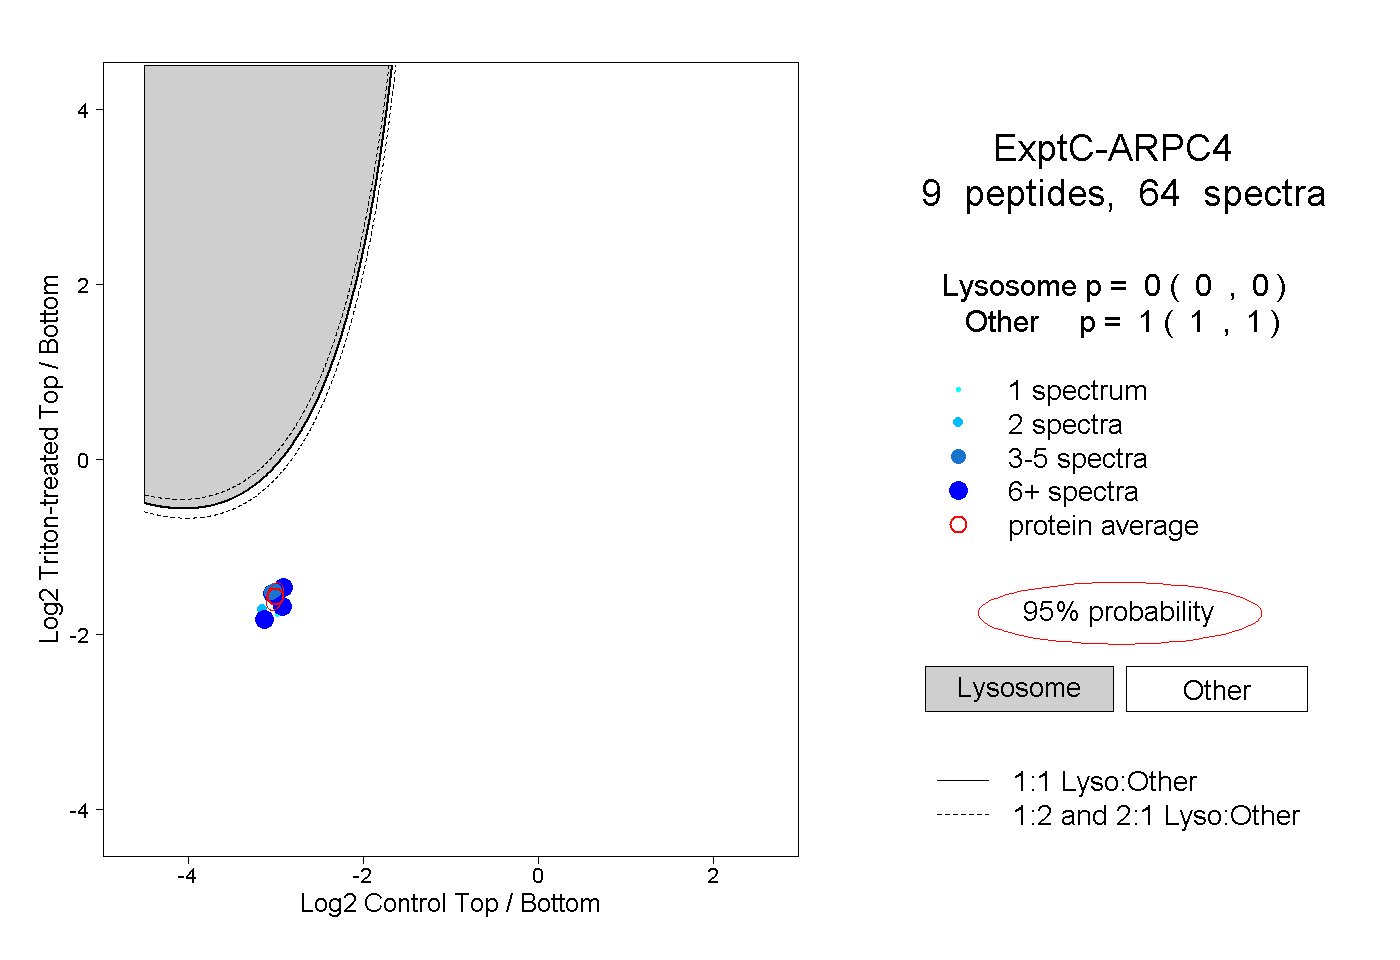 |
|
0.000
0.000 | 0.000 |
|
|
|
|
|
|
|
1.000
1.000 | 1.000 |
| | | Plot |
|
Lyso |
|
|
|
|
|
|
|
Other |
| Expt D |
4
peptides |
11
spectra |
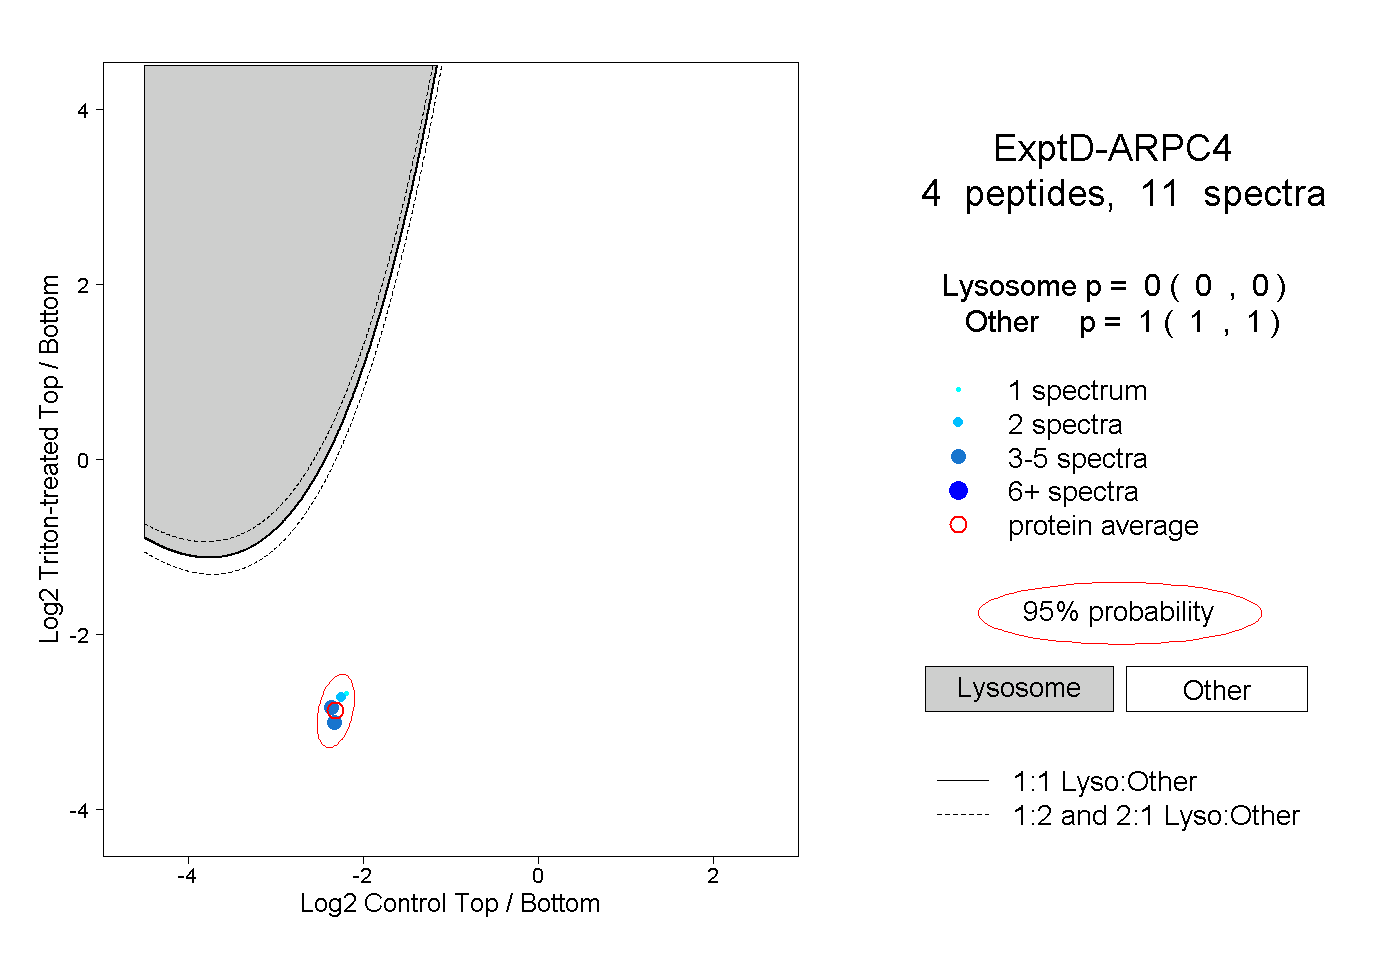 |
|
0.000
0.000 | 0.000 |
|
|
|
|
|
|
|
1.000
1.000 | 1.000 |