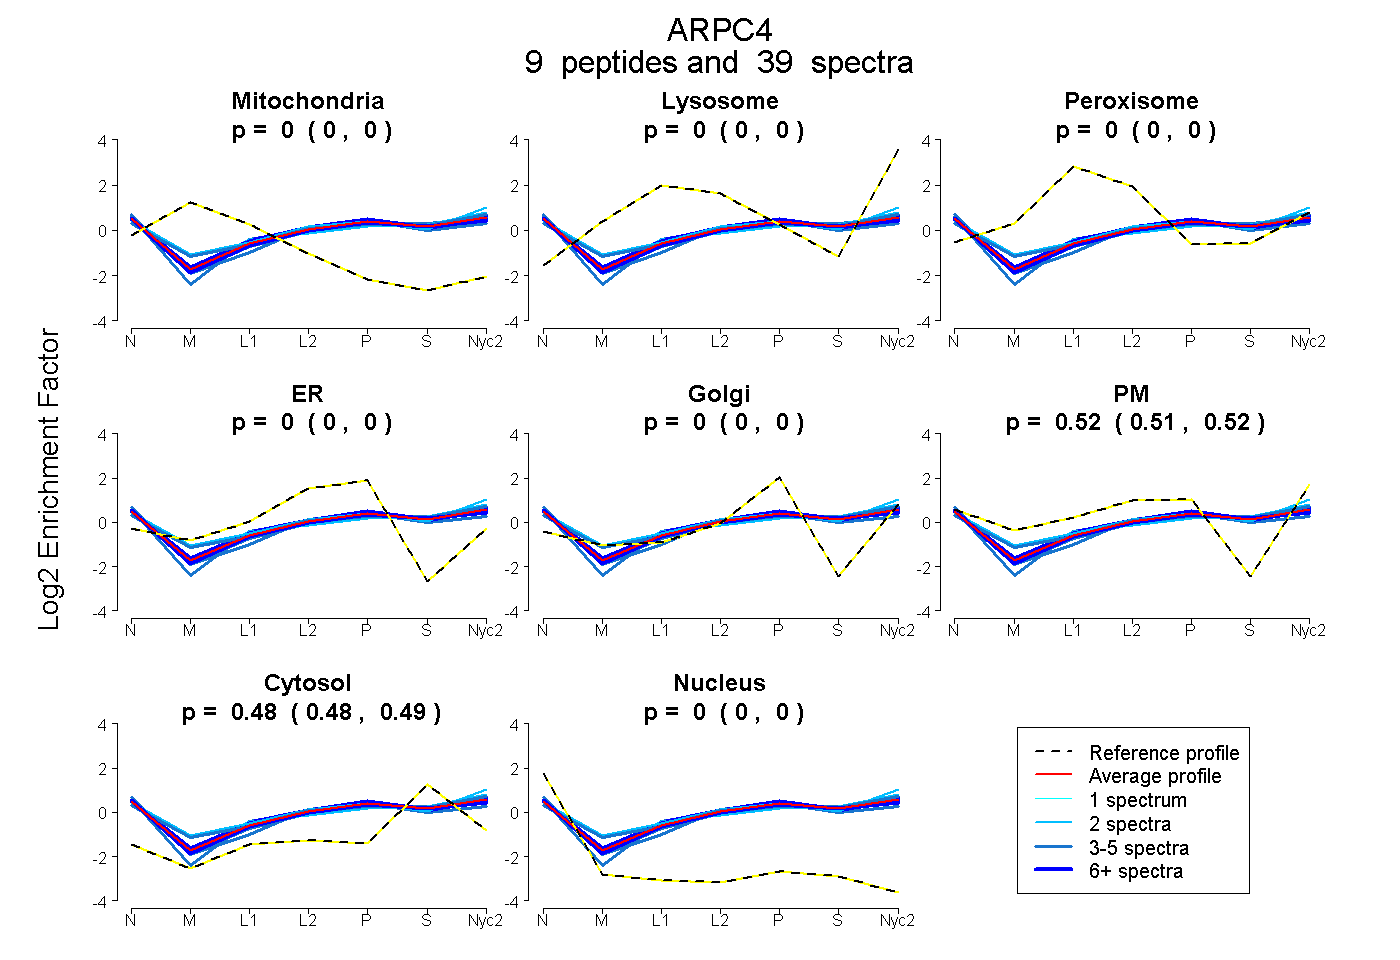
 9
9peptides
spectra
0.000 | 0.000
0.000 | 0.000
0.000 | 0.000
0.000 | 0.000
0.000 | 0.000
0.514 | 0.519
0.481 | 0.486
0.000 | 0.000
| Plot | Mito | Lyso | Perox | ER | Golgi | PM | Cytosol | Nucleus | |||||
| Expt A |
9 peptides |
39 spectra |
|
0.000 0.000 | 0.000 |
0.000 0.000 | 0.000 |
0.000 0.000 | 0.000 |
0.000 0.000 | 0.000 |
0.000 0.000 | 0.000 |
0.516 0.514 | 0.519 |
0.484 0.481 | 0.486 |
0.000 0.000 | 0.000 |
| 4 spectra, ELLLQPVTISR | 0.000 | 0.000 | 0.000 | 0.000 | 0.000 | 0.488 | 0.512 | 0.000 | ||
| 3 spectra, TATLRPYLSAVR | 0.000 | 0.000 | 0.022 | 0.000 | 0.000 | 0.517 | 0.461 | 0.000 | ||
| 8 spectra, VLIEGSINSVR | 0.000 | 0.000 | 0.000 | 0.000 | 0.000 | 0.492 | 0.508 | 0.000 | ||
| 8 spectra, LSVNAR | 0.000 | 0.000 | 0.000 | 0.000 | 0.000 | 0.531 | 0.469 | 0.000 | ||
| 3 spectra, AENFFILR | 0.000 | 0.000 | 0.000 | 0.000 | 0.000 | 0.478 | 0.522 | 0.000 | ||
| 6 spectra, IVAEEFLK | 0.000 | 0.000 | 0.000 | 0.000 | 0.000 | 0.535 | 0.465 | 0.000 | ||
| 2 spectra, KPVEGYDISFLITNFHTEQMYK | 0.000 | 0.000 | 0.000 | 0.000 | 0.000 | 0.503 | 0.497 | 0.000 | ||
| 2 spectra, QADEIEK | 0.000 | 0.021 | 0.002 | 0.000 | 0.000 | 0.569 | 0.407 | 0.000 | ||
| 3 spectra, HNKPEVEVR | 0.000 | 0.000 | 0.000 | 0.014 | 0.000 | 0.486 | 0.478 | 0.022 |
| Plot | Mito | Lyso or Perox | ER | Golgi | PM | Cytosol | Nucleus | ||||||
| Expt B |
6 peptides |
33 spectra |
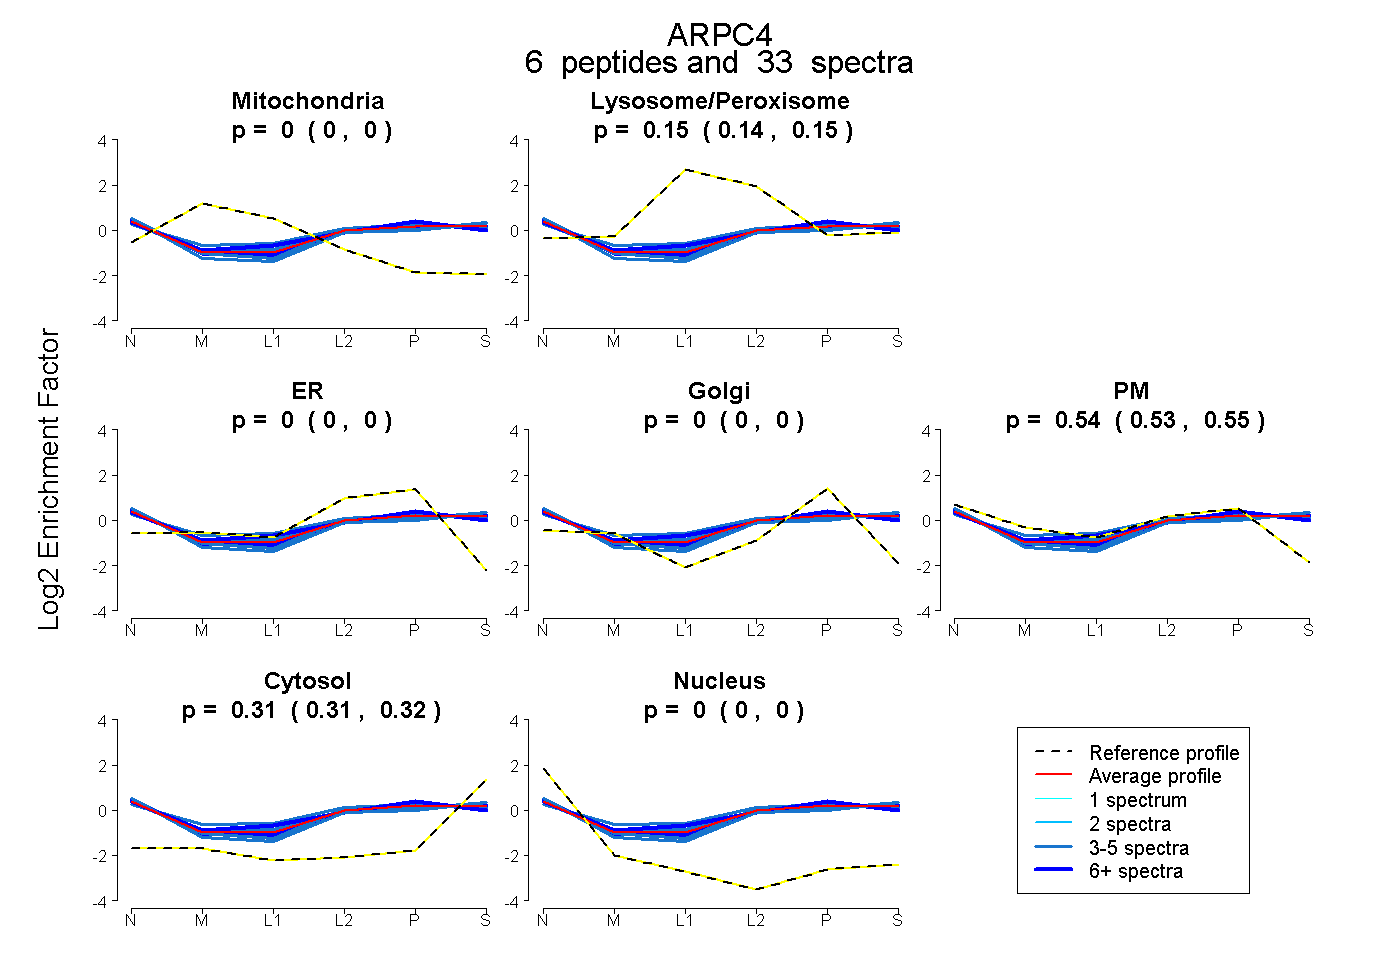 |
0.000 0.000 | 0.000 |
0.146 0.137 | 0.153 |
0.000 0.000 | 0.000 |
0.000 0.000 | 0.000 |
0.542 0.535 | 0.548 |
0.312 0.308 | 0.315 |
0.000 0.000 | 0.000 |
|||
| Plot | Lyso | Other | |||||||||||
| Expt C |
9 peptides |
64 spectra |
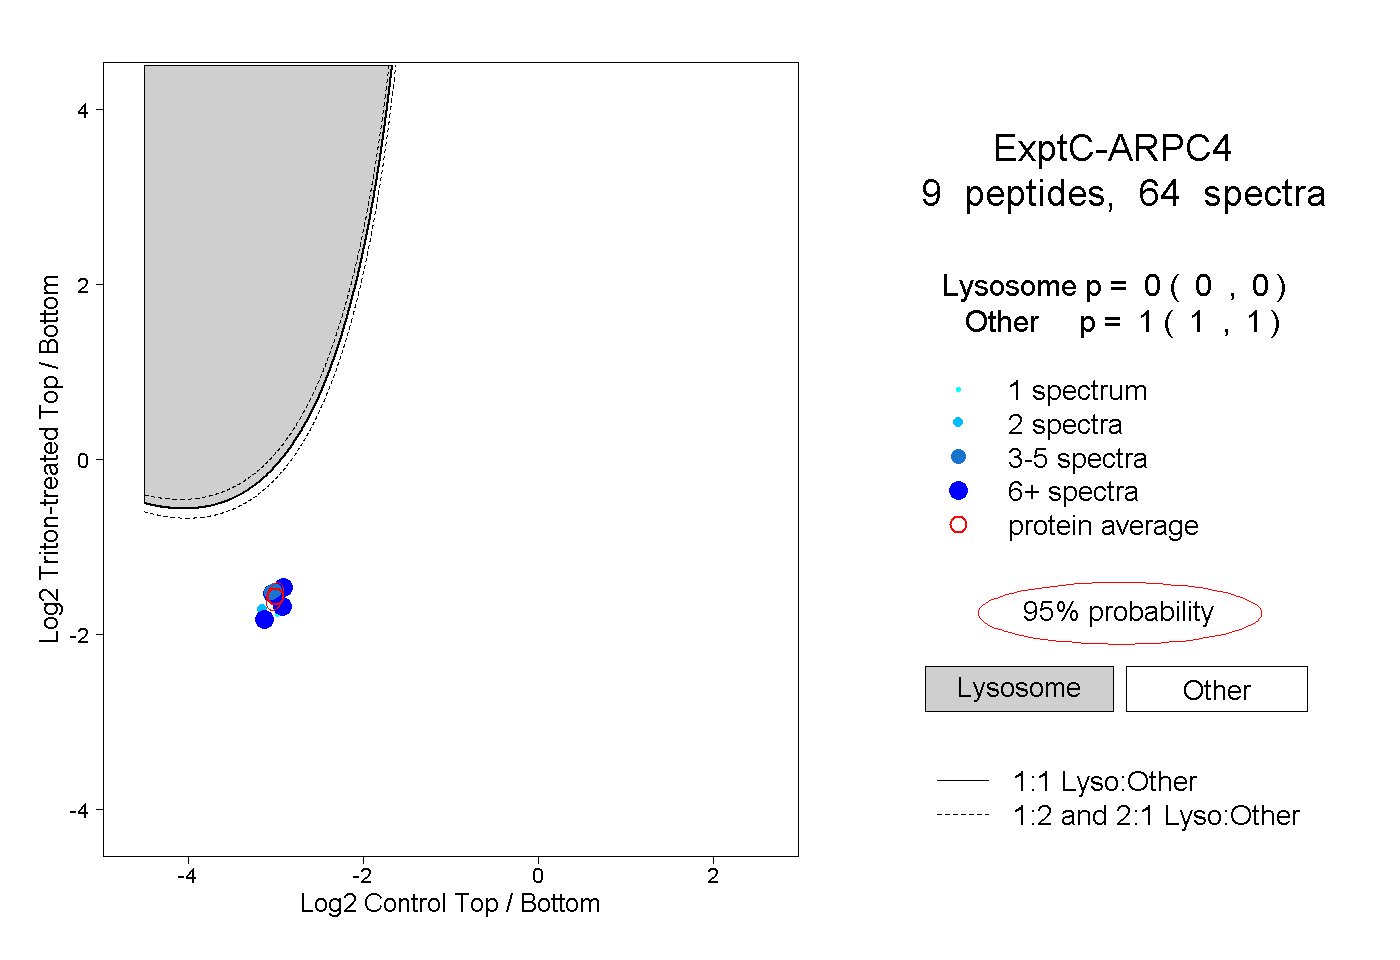 |
0.000 0.000 | 0.000 |
1.000 1.000 | 1.000 |
||||||||
| Plot | Lyso | Other | |||||||||||
| Expt D |
4 peptides |
11 spectra |
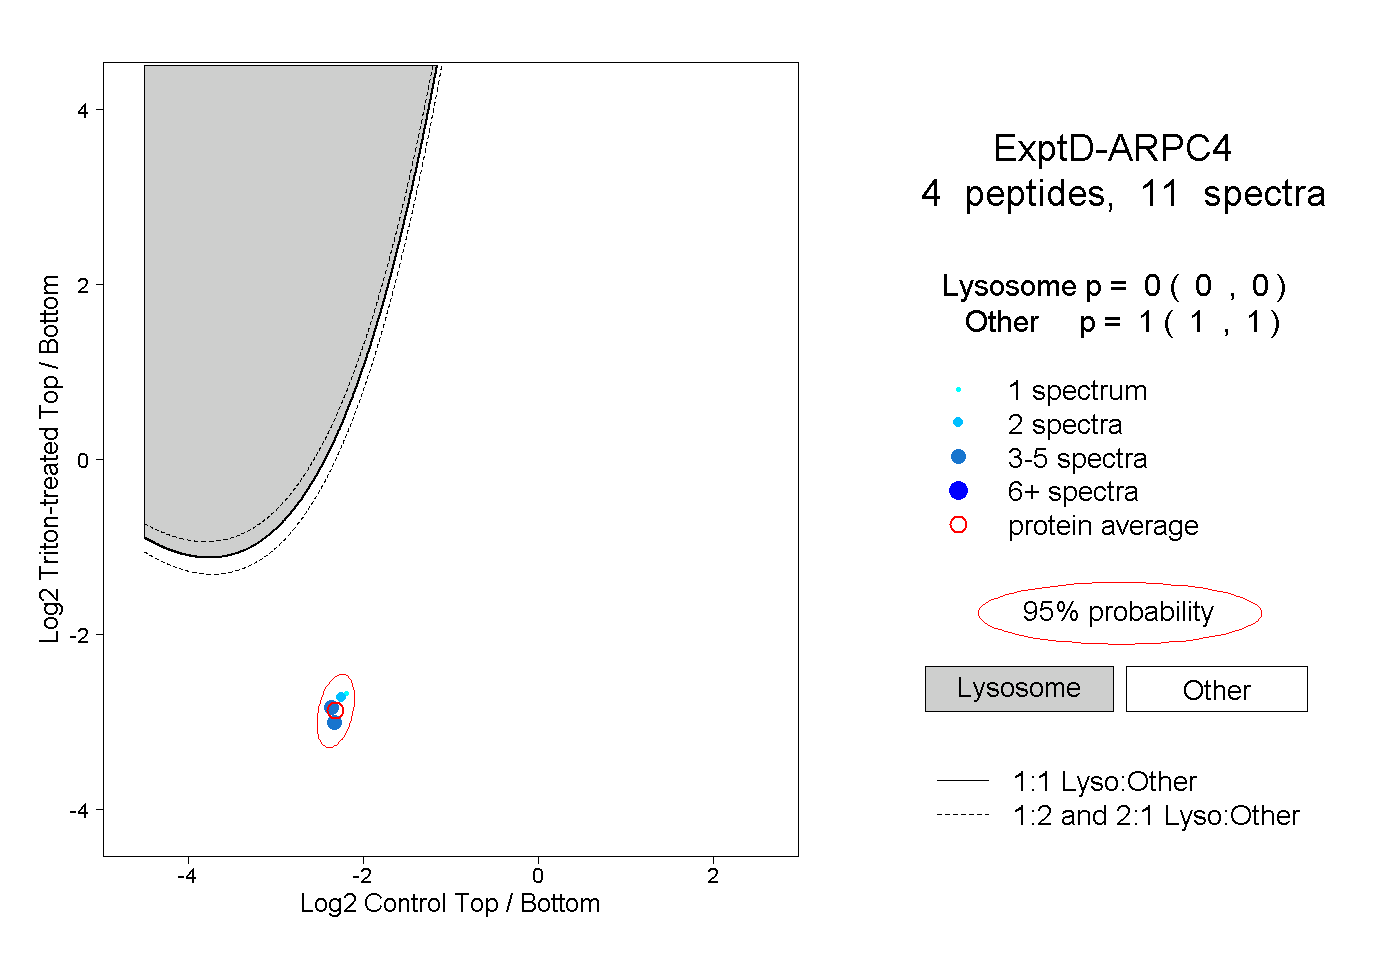 |
0.000 0.000 | 0.000 |
1.000 1.000 | 1.000 |