 3
3peptides
spectra
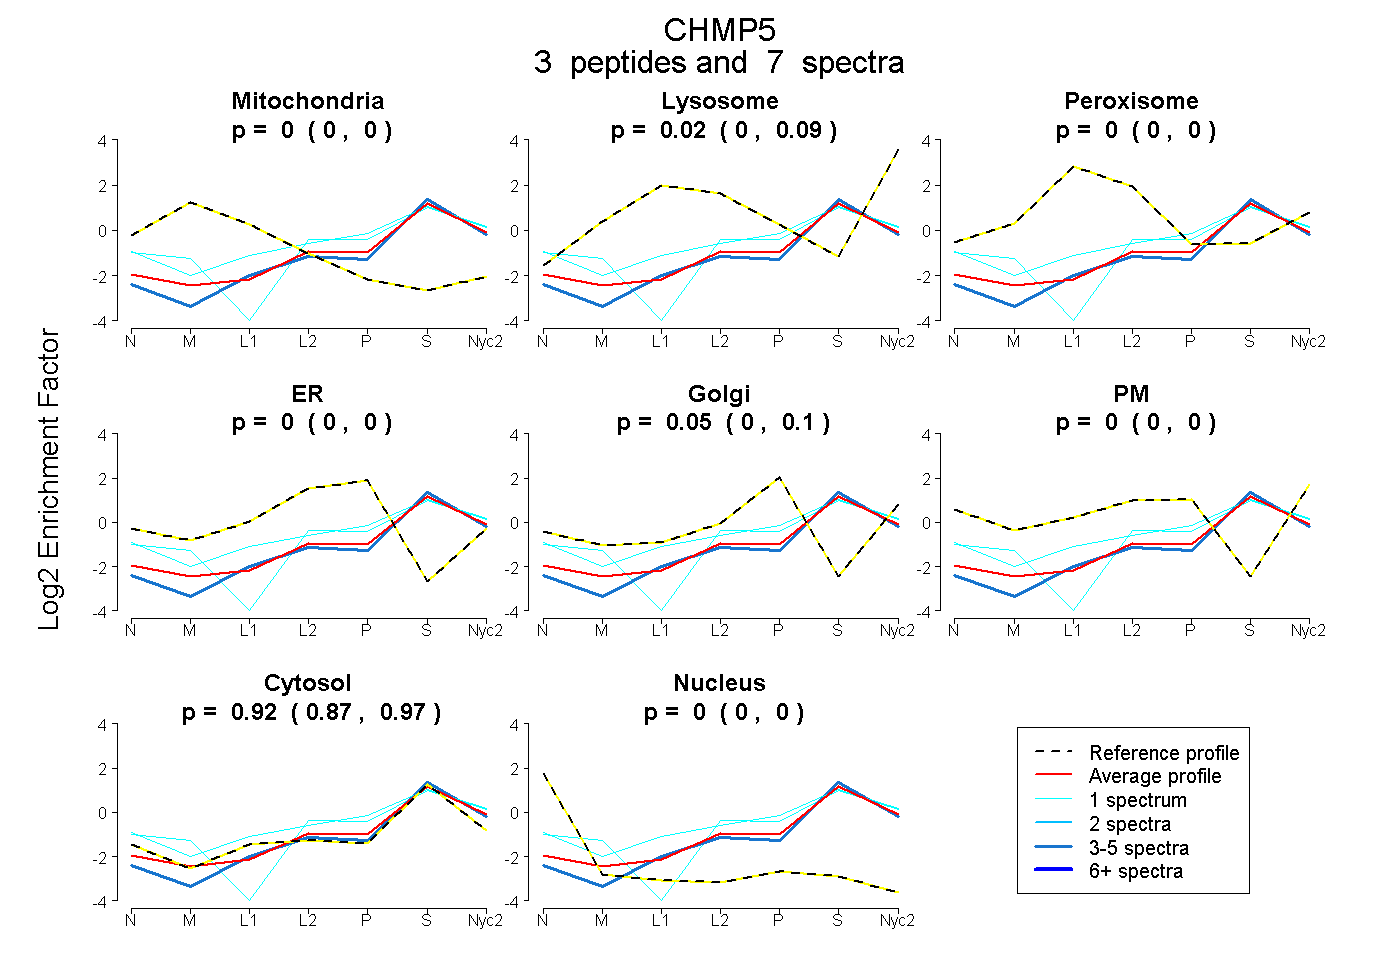
0.000 | 0.000
0.000 | 0.093
0.000 | 0.000
0.000 | 0.000
0.000 | 0.100
0.000 | 0.000
0.866 | 0.968
0.000 | 0.000
| Plot | Mito | Lyso | Perox | ER | Golgi | PM | Cytosol | Nucleus | |||||
| Expt A |
3 peptides |
7 spectra |
|
0.000 0.000 | 0.000 |
0.023 0.000 | 0.093 |
0.000 0.000 | 0.000 |
0.000 0.000 | 0.000 |
0.053 0.000 | 0.100 |
0.000 0.000 | 0.000 |
0.924 0.866 | 0.968 |
0.000 0.000 | 0.000 |
| 1 spectrum, APPPSLTDCIGTVDSR | 0.000 | 0.000 | 0.000 | 0.000 | 0.239 | 0.000 | 0.761 | 0.000 | ||
| 5 spectra, LDAELVK | 0.000 | 0.000 | 0.000 | 0.000 | 0.000 | 0.000 | 1.000 | 0.000 | ||
| 1 spectrum, MYEQQR | 0.000 | 0.116 | 0.000 | 0.000 | 0.151 | 0.011 | 0.723 | 0.000 |
| Plot | Lyso | Other | |||||||||||
| Expt C |
3 peptides |
5 spectra |
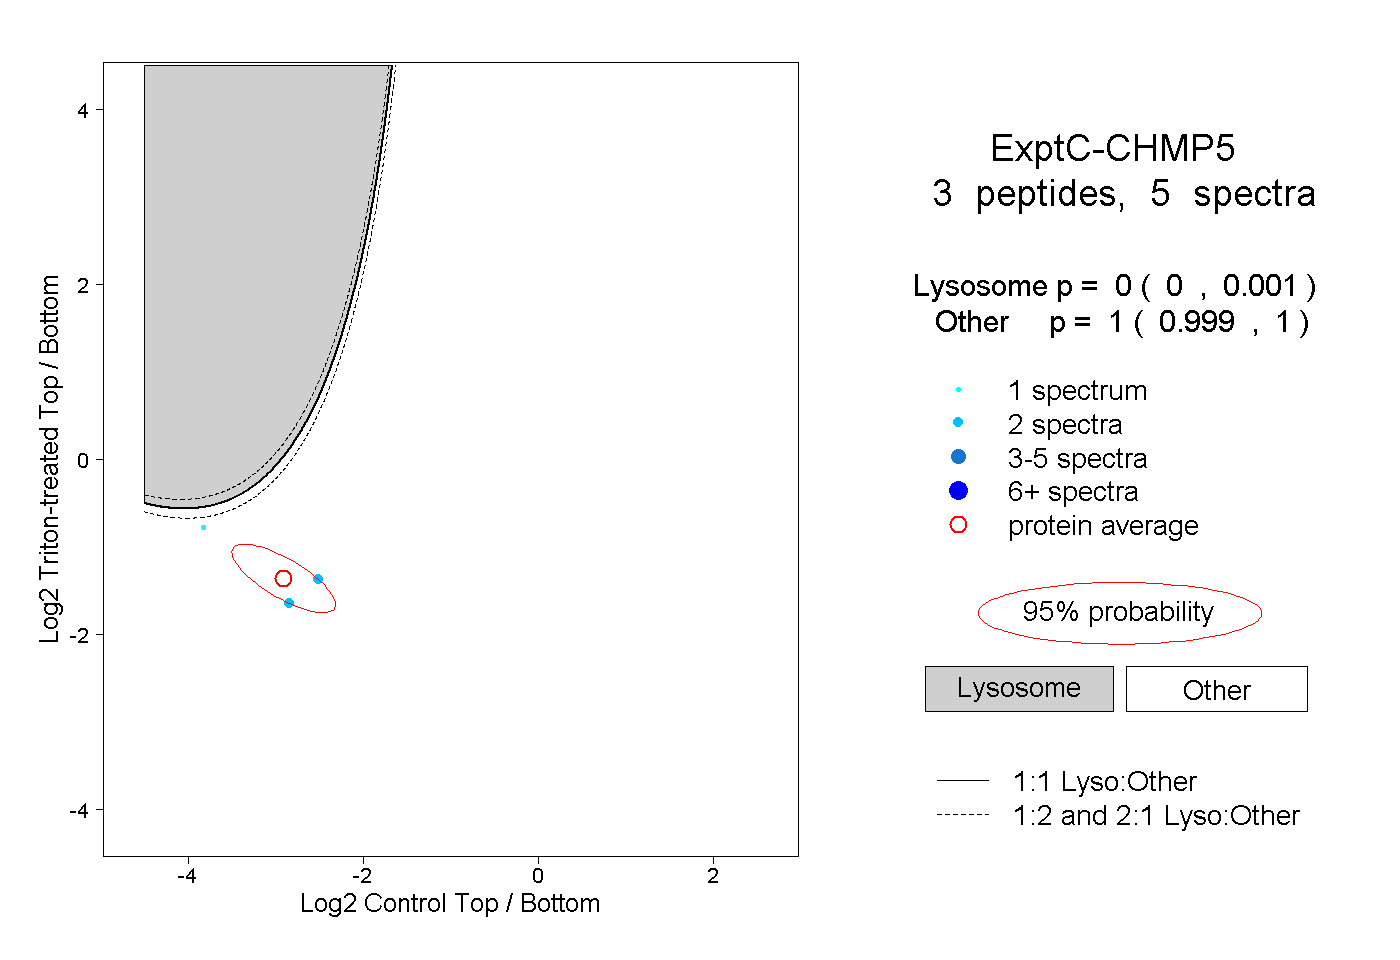 |
0.000 0.000 | 0.001 |
1.000 0.999 | 1.000 |
||||||||
| Plot | Lyso | Other | |||||||||||
| Expt D |
1 peptide |
1 spectrum |
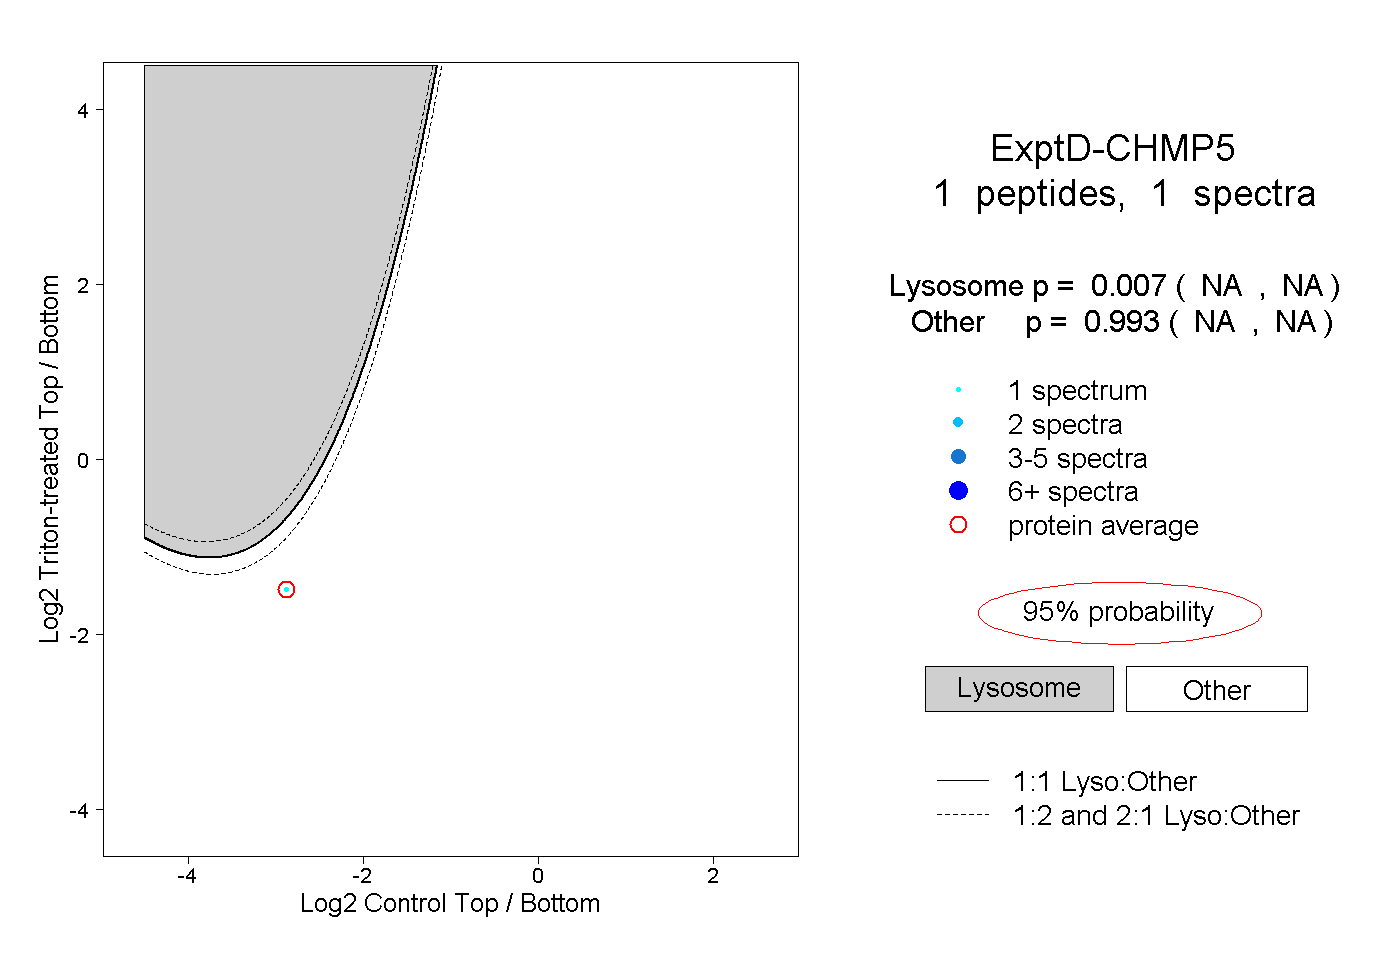 |
0.007 NA | NA |
0.993 NA | NA |