24
24peptides
spectra
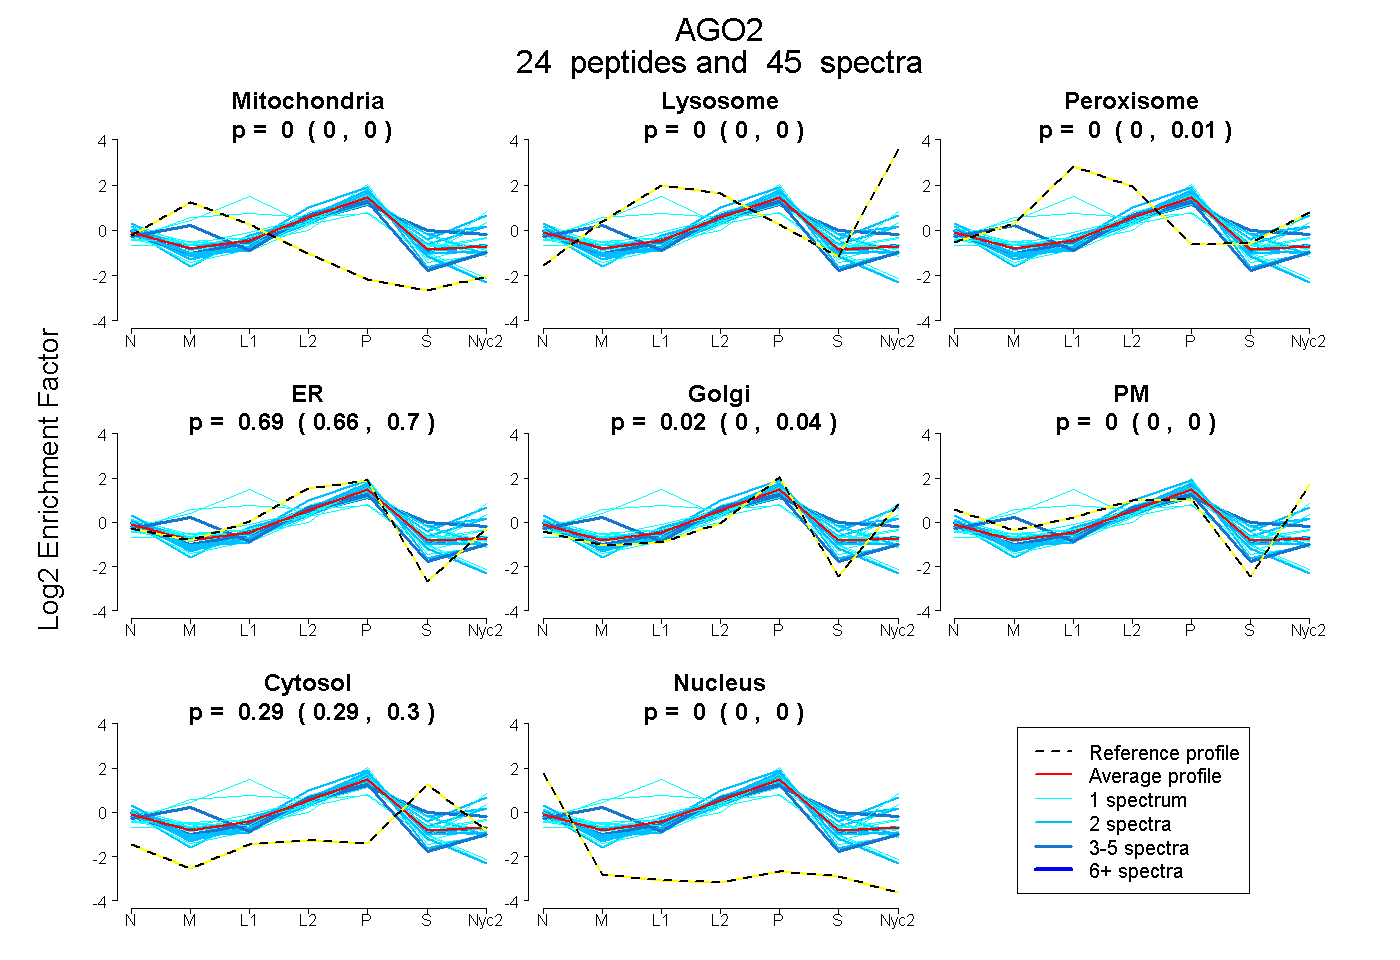
0.000 | 0.000
0.000 | 0.000
0.000 | 0.010
0.663 | 0.700
0.000 | 0.036
0.000 | 0.000
0.286 | 0.297
0.000 | 0.000
6peptides
spectra
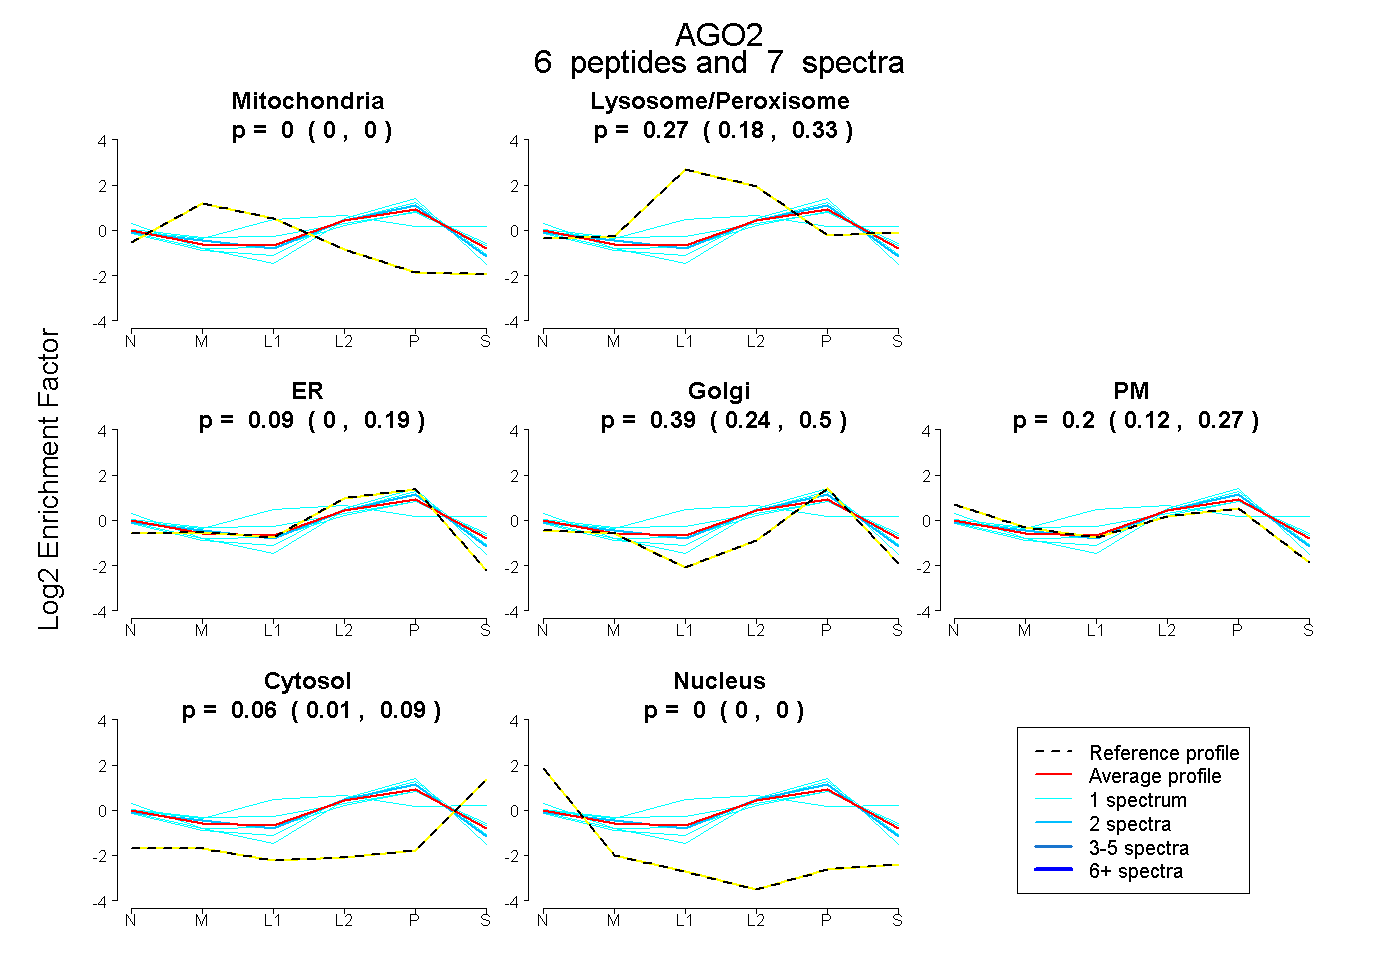
0.000 | 0.000
0.180 | 0.334
0.000 | 0.189
0.237 | 0.504
0.115 | 0.272
0.014 | 0.095
0.000 | 0.000