 24
24peptides
spectra
0.000 | 0.000
0.000 | 0.000
0.000 | 0.010
0.663 | 0.700
0.000 | 0.036
0.000 | 0.000
0.286 | 0.297
0.000 | 0.000
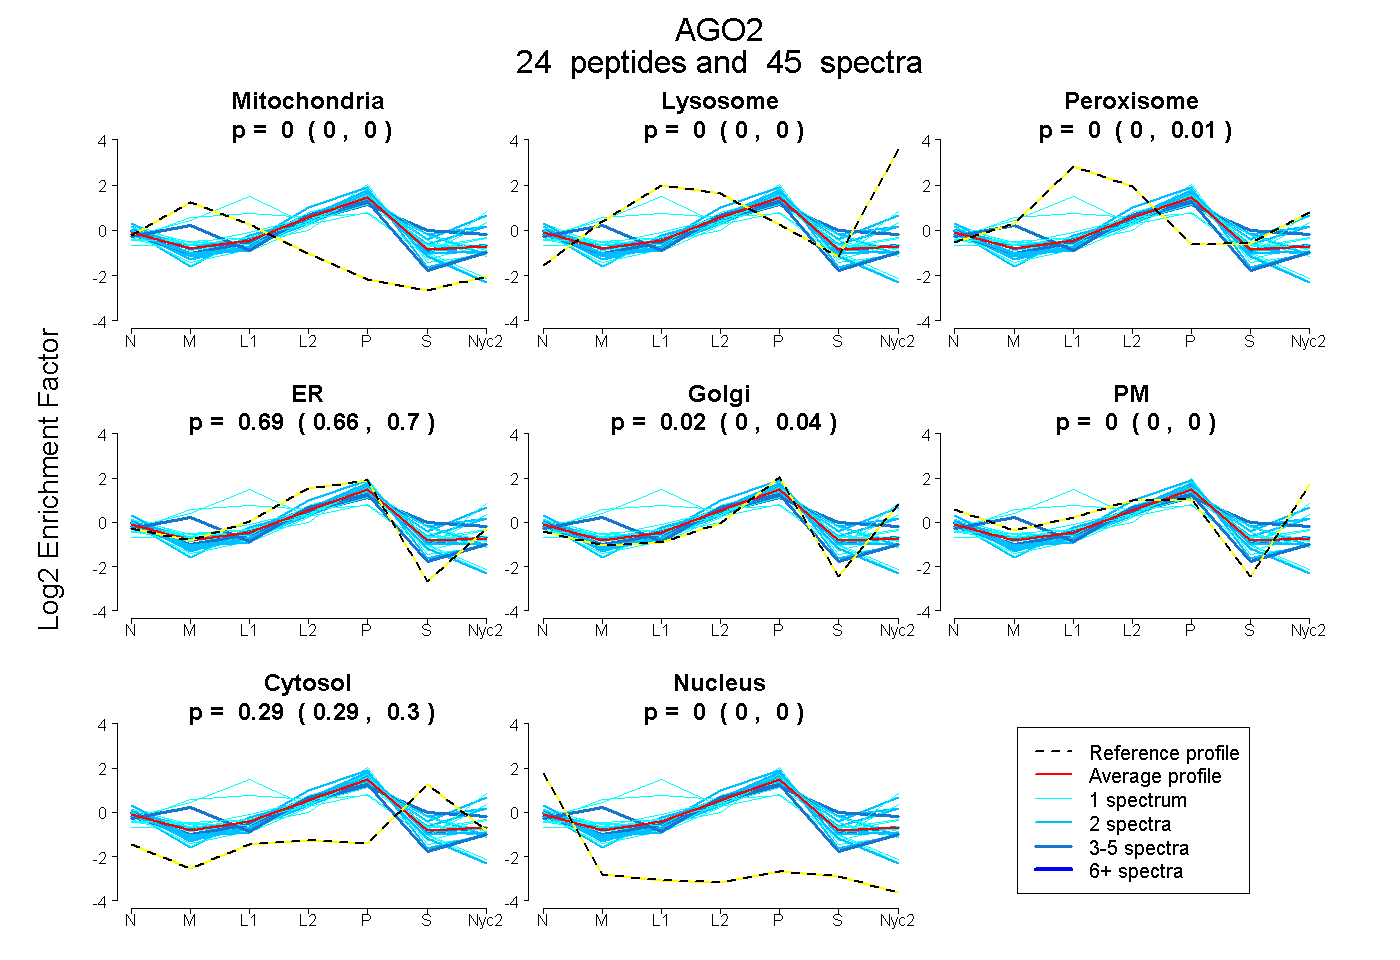
| Plot | Mito | Lyso | Perox | ER | Golgi | PM | Cytosol | Nucleus | |||||
| Expt A |
24 peptides |
45 spectra |
|
0.000 0.000 | 0.000 |
0.000 0.000 | 0.000 |
0.003 0.000 | 0.010 |
0.687 0.663 | 0.700 |
0.018 0.000 | 0.036 |
0.000 0.000 | 0.000 |
0.293 0.286 | 0.297 |
0.000 0.000 | 0.000 |
| 1 spectrum, LTDNQTSTMIR | 0.028 | 0.000 | 0.000 | 0.620 | 0.160 | 0.000 | 0.192 | 0.000 | ||
| 2 spectra, AVQVHQDTLR | 0.000 | 0.000 | 0.011 | 0.082 | 0.250 | 0.361 | 0.296 | 0.000 | ||
| 1 spectrum, SIEEQQKPLTDSQR | 0.000 | 0.000 | 0.000 | 0.670 | 0.000 | 0.000 | 0.204 | 0.126 | ||
| 1 spectrum, TPVYAEVK | 0.000 | 0.000 | 0.066 | 0.658 | 0.000 | 0.000 | 0.277 | 0.000 | ||
| 2 spectra, KPSIAAVVGSMDAHPNR | 0.000 | 0.000 | 0.005 | 0.590 | 0.000 | 0.000 | 0.405 | 0.000 | ||
| 4 spectra, DEMTDVTGR | 0.000 | 0.000 | 0.000 | 0.687 | 0.039 | 0.000 | 0.273 | 0.000 | ||
| 1 spectrum, VEITHCGQMK | 0.008 | 0.000 | 0.074 | 0.563 | 0.000 | 0.040 | 0.282 | 0.033 | ||
| 5 spectra, YCATVR | 0.208 | 0.000 | 0.000 | 0.575 | 0.131 | 0.000 | 0.087 | 0.000 | ||
| 1 spectrum, NLYTAMPLPIGR | 0.003 | 0.000 | 0.000 | 0.556 | 0.010 | 0.156 | 0.274 | 0.000 | ||
| 1 spectrum, VLQPPSILYGGR | 0.000 | 0.000 | 0.000 | 0.575 | 0.022 | 0.000 | 0.403 | 0.000 | ||
| 2 spectra, EFGIMVK | 0.000 | 0.000 | 0.059 | 0.318 | 0.140 | 0.231 | 0.252 | 0.000 | ||
| 1 spectrum, VGDTVLGMATQCVQMK | 0.123 | 0.155 | 0.325 | 0.000 | 0.398 | 0.000 | 0.000 | 0.000 | ||
| 5 spectra, EIVEHMVQHFK | 0.000 | 0.000 | 0.000 | 0.699 | 0.014 | 0.000 | 0.286 | 0.000 | ||
| 2 spectra, QEIIQDLAAMVR | 0.000 | 0.000 | 0.000 | 0.819 | 0.000 | 0.000 | 0.139 | 0.042 | ||
| 2 spectra, YAQGADSVEPMFR | 0.000 | 0.000 | 0.000 | 0.673 | 0.057 | 0.000 | 0.260 | 0.010 | ||
| 3 spectra, TQIFGDR | 0.000 | 0.000 | 0.107 | 0.332 | 0.177 | 0.018 | 0.366 | 0.000 | ||
| 1 spectrum, SVSIPAPAYYAHLVAFR | 0.000 | 0.000 | 0.000 | 0.664 | 0.000 | 0.000 | 0.245 | 0.091 | ||
| 2 spectra, ELLIQFYK | 0.000 | 0.000 | 0.000 | 0.685 | 0.001 | 0.000 | 0.306 | 0.009 | ||
| 2 spectra, SASFNTDPYVR | 0.000 | 0.000 | 0.007 | 0.237 | 0.197 | 0.197 | 0.362 | 0.000 | ||
| 1 spectrum, YTPVGR | 0.000 | 0.000 | 0.106 | 0.373 | 0.292 | 0.000 | 0.228 | 0.000 | ||
| 2 spectra, VWAIACFAPQR | 0.000 | 0.000 | 0.000 | 0.689 | 0.000 | 0.000 | 0.150 | 0.161 | ||
| 1 spectrum, TTPQTLSNLCLK | 0.000 | 0.000 | 0.002 | 0.671 | 0.000 | 0.000 | 0.327 | 0.000 | ||
| 1 spectrum, QCTEVHLK | 0.000 | 0.000 | 0.000 | 0.557 | 0.222 | 0.000 | 0.194 | 0.027 | ||
| 1 spectrum, SFFTASEGCSNPLGGGR | 0.110 | 0.000 | 0.518 | 0.000 | 0.372 | 0.000 | 0.000 | 0.000 |
| Plot | Mito | Lyso or Perox | ER | Golgi | PM | Cytosol | Nucleus | ||||||
| Expt B |
6 peptides |
7 spectra |
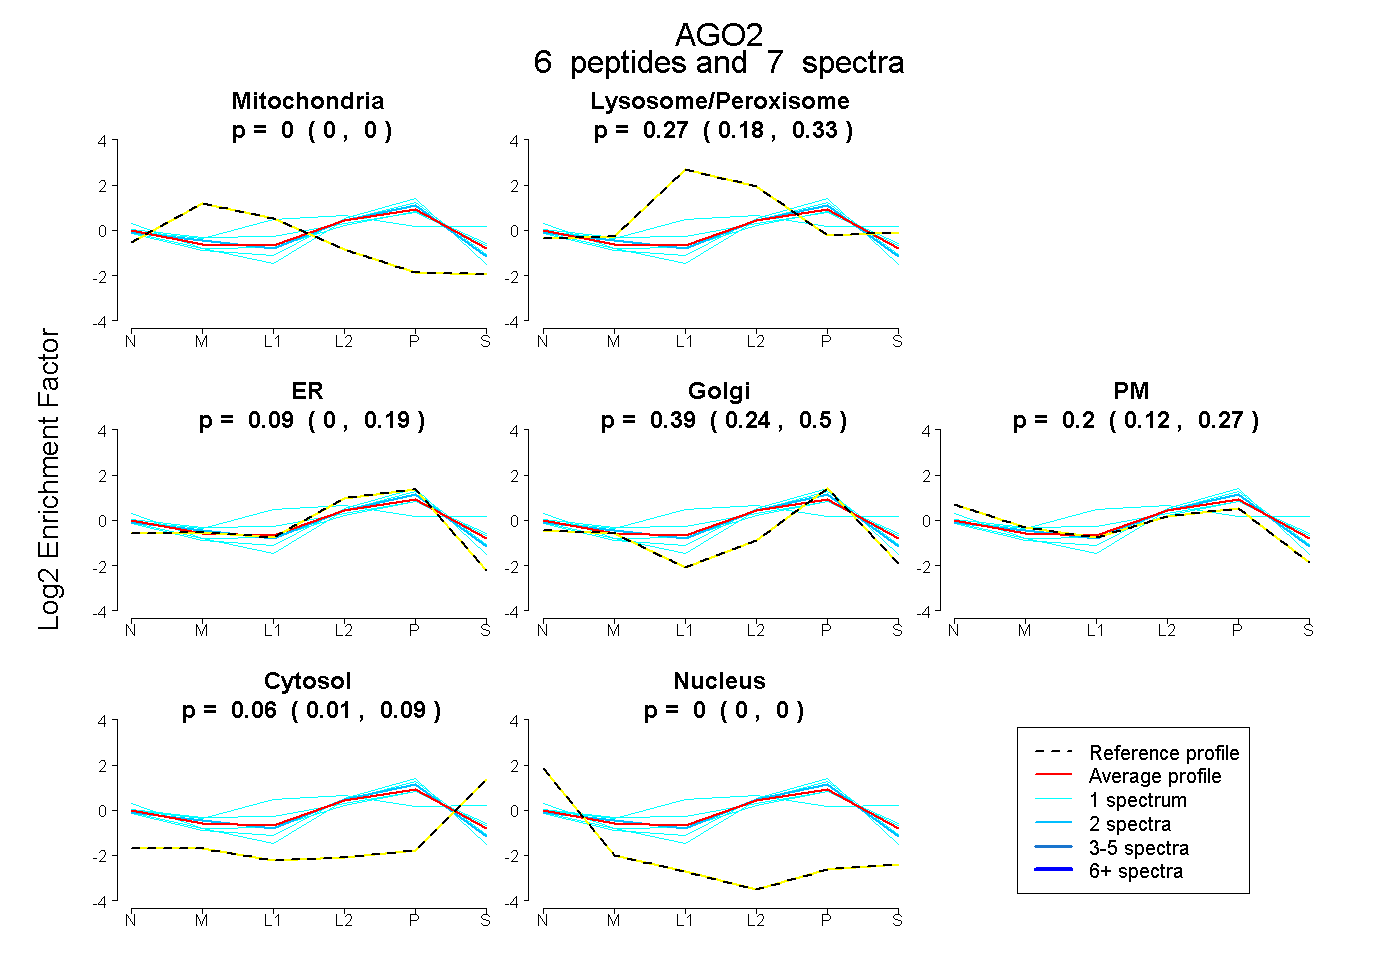 |
0.000 0.000 | 0.000 |
0.266 0.180 | 0.334 |
0.088 0.000 | 0.189 |
0.389 0.237 | 0.504 |
0.200 0.115 | 0.272 |
0.057 0.014 | 0.095 |
0.000 0.000 | 0.000 |
|||
| Plot | Lyso | Other | |||||||||||
| Expt C |
13 peptides |
29 spectra |
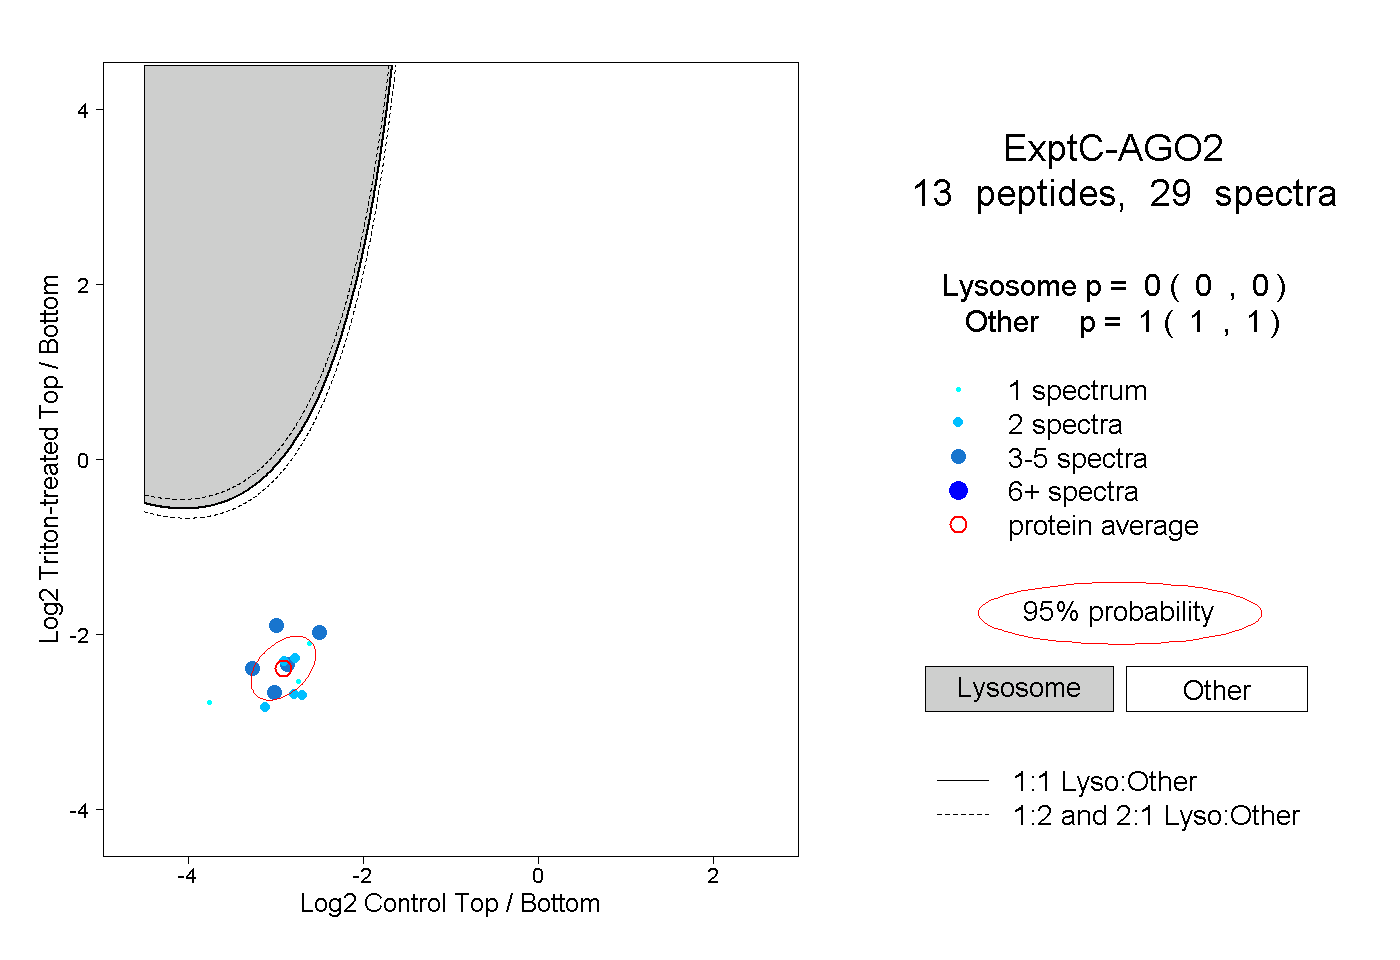 |
0.000 0.000 | 0.000 |
1.000 1.000 | 1.000 |
||||||||
| Plot | Lyso | Other | |||||||||||
| Expt D |
1 peptide |
2 spectra |
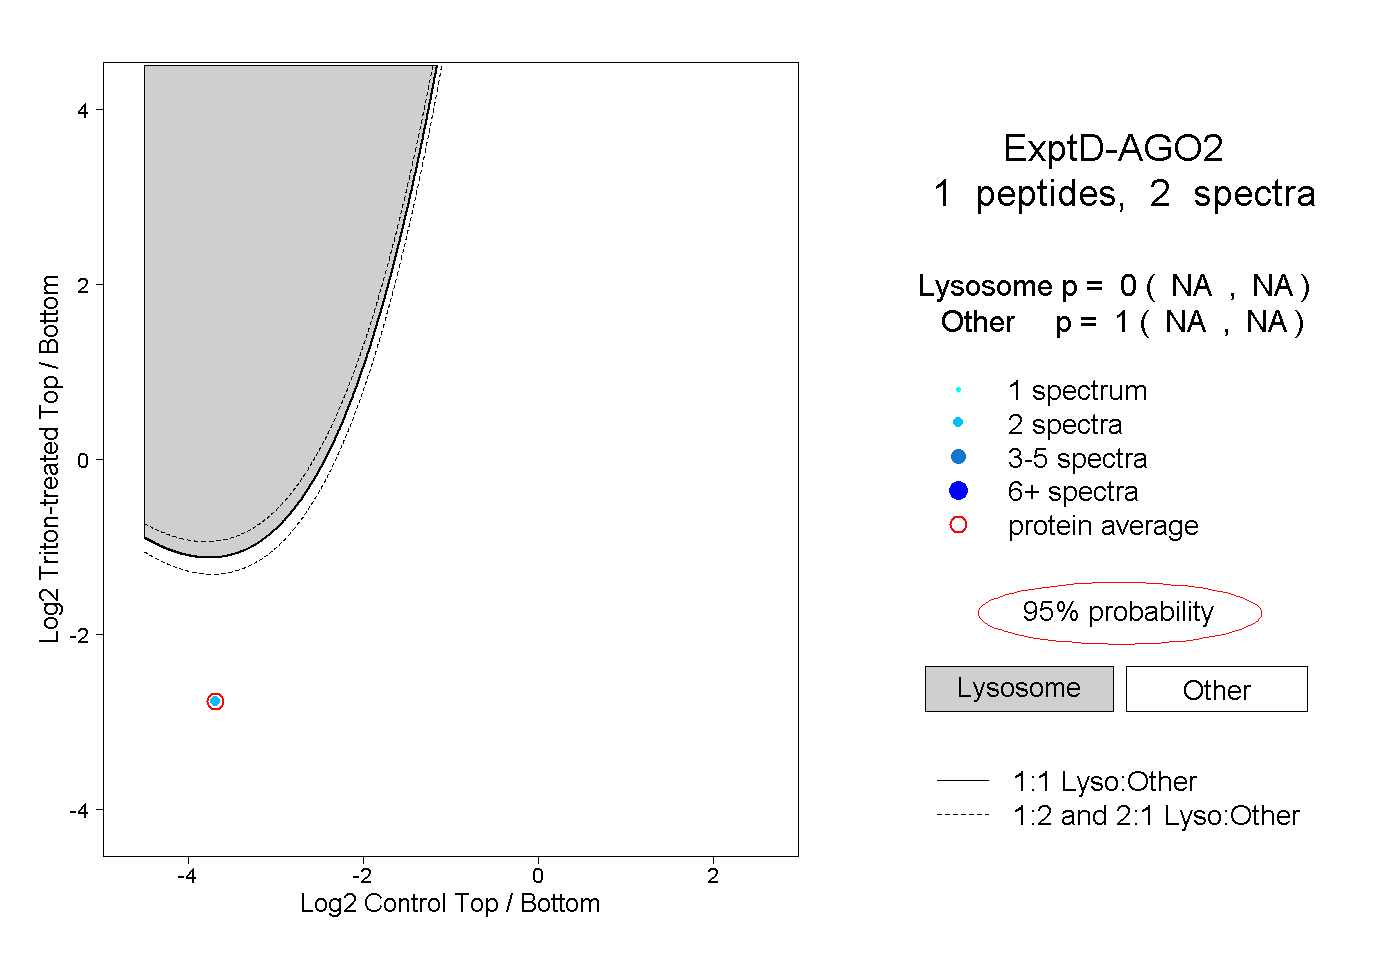 |
0.000 NA | NA |
1.000 NA | NA |