8
8peptides
spectra
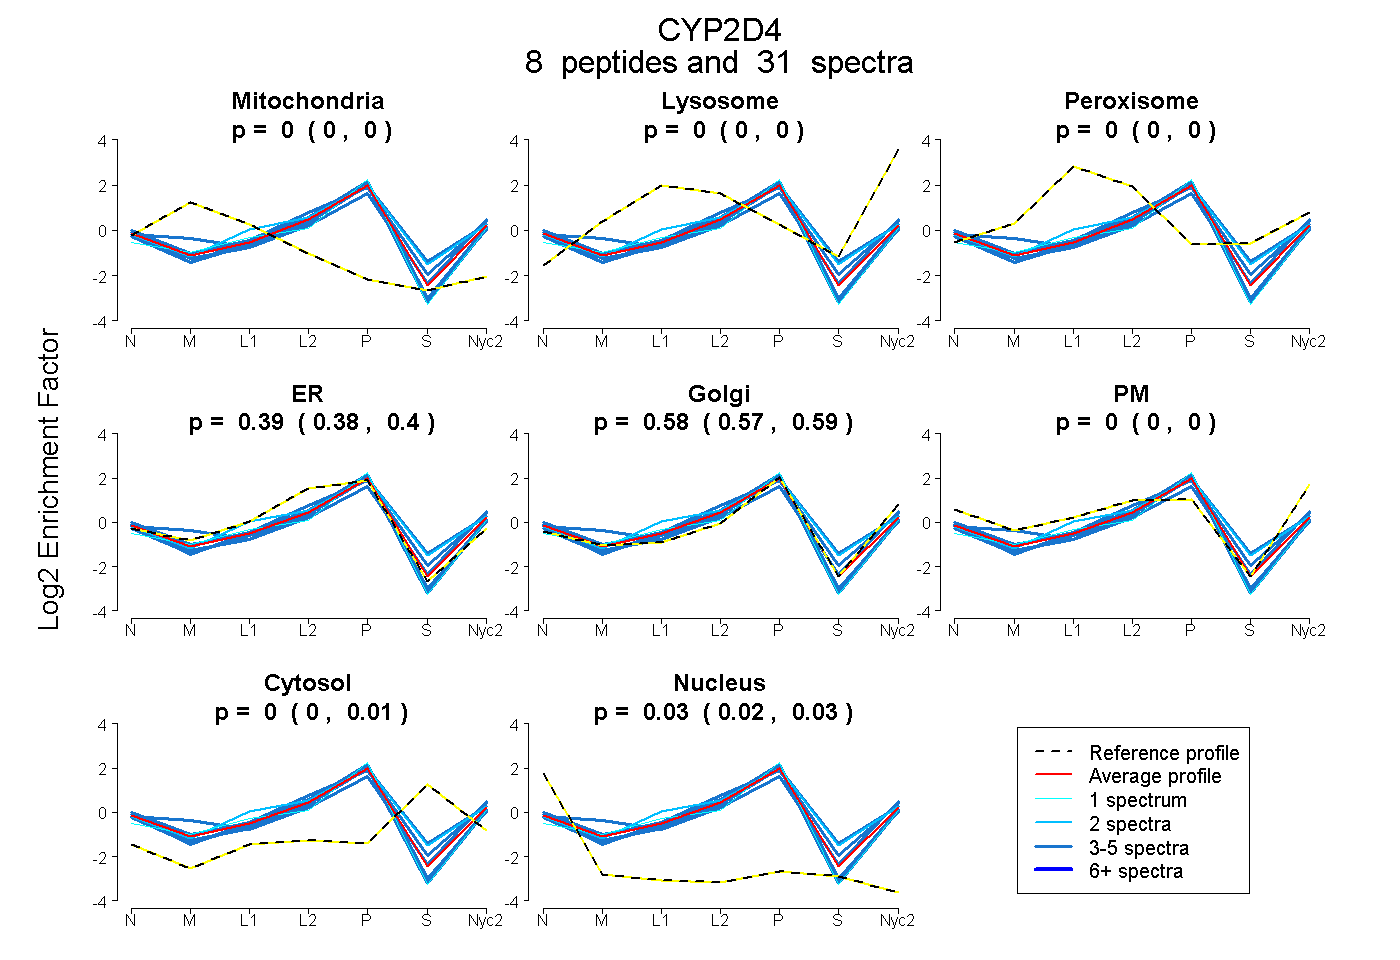
0.000 | 0.000
0.000 | 0.000
0.000 | 0.000
0.382 | 0.405
0.566 | 0.588
0.000 | 0.000
0.000 | 0.012
0.019 | 0.029
7peptides
spectra
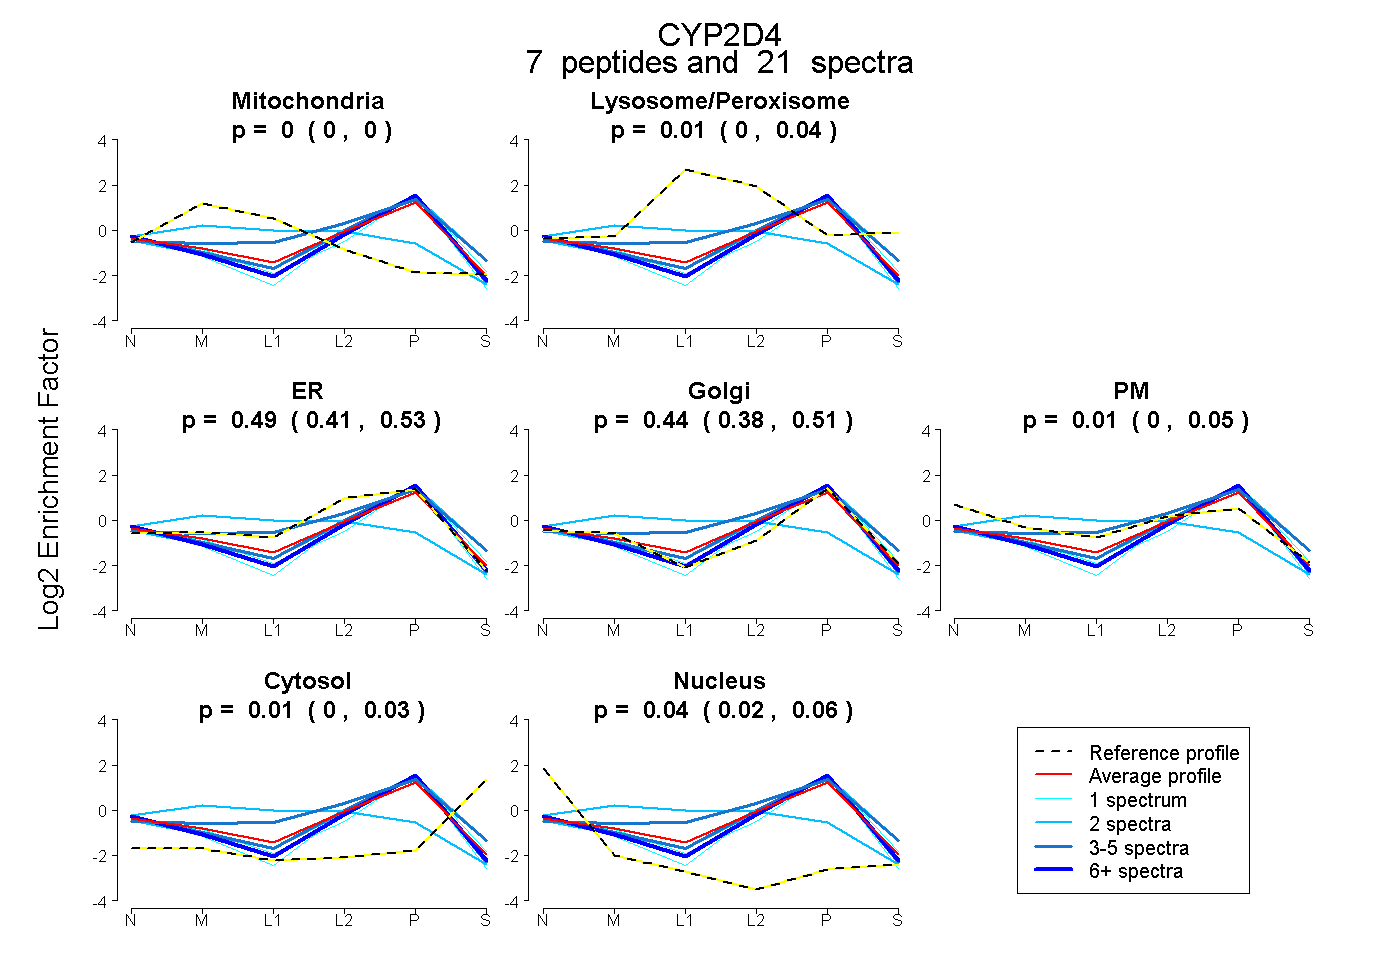
0.000 | 0.000
0.000 | 0.038
0.405 | 0.530
0.376 | 0.506
0.000 | 0.054
0.000 | 0.028
0.016 | 0.061