 8
8peptides
spectra
0.000 | 0.000
0.000 | 0.000
0.000 | 0.000
0.382 | 0.405
0.566 | 0.588
0.000 | 0.000
0.000 | 0.012
0.019 | 0.029
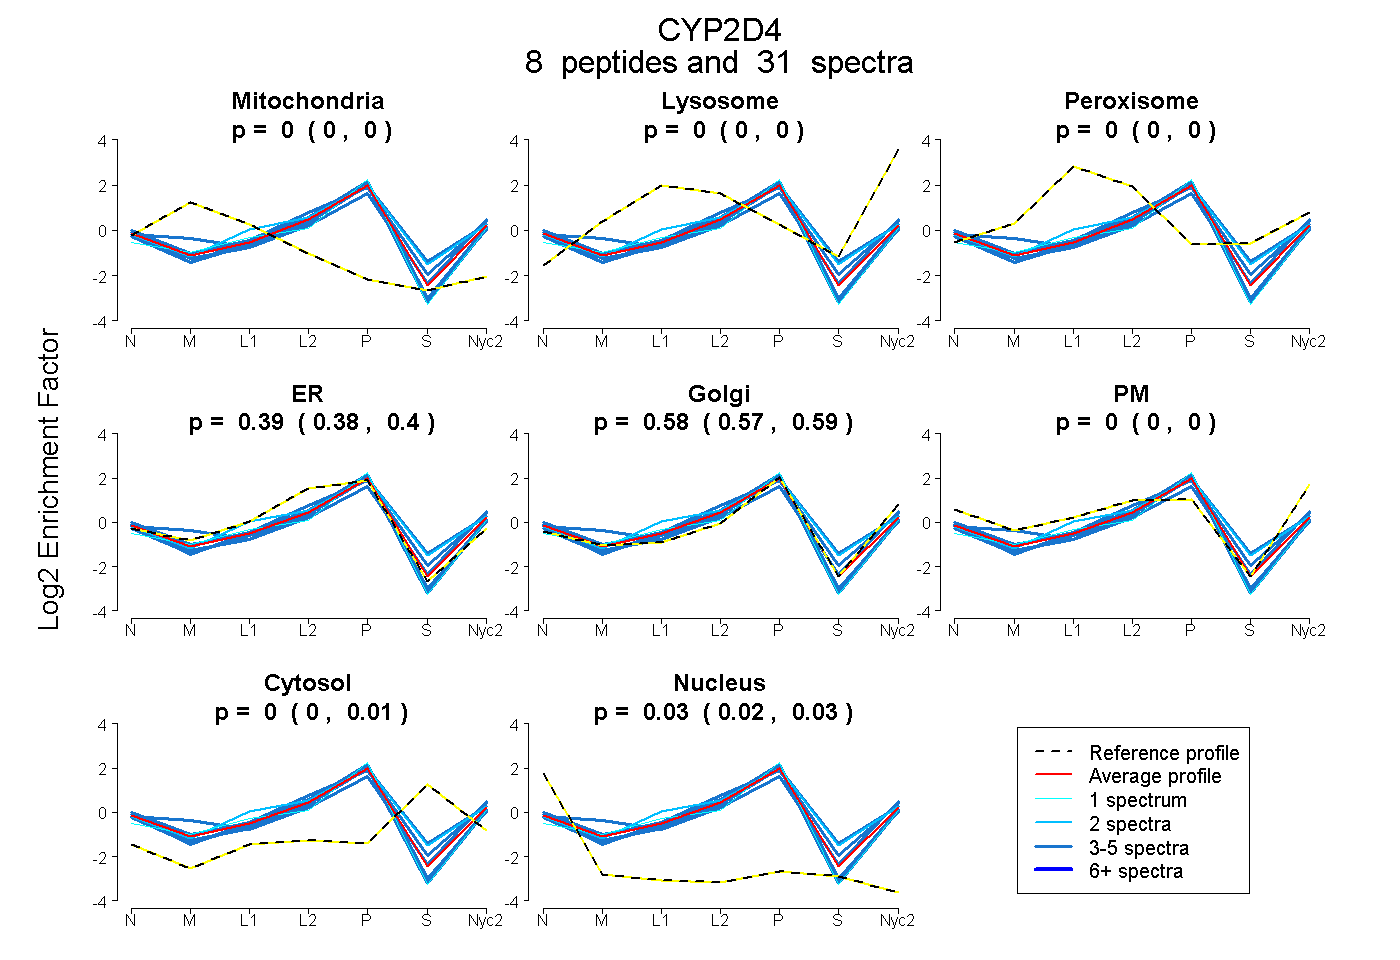
| Plot | Mito | Lyso | Perox | ER | Golgi | PM | Cytosol | Nucleus | |||||
| Expt A |
8 peptides |
31 spectra |
|
0.000 0.000 | 0.000 |
0.000 0.000 | 0.000 |
0.000 0.000 | 0.000 |
0.394 0.382 | 0.405 |
0.579 0.566 | 0.588 |
0.000 0.000 | 0.000 |
0.000 0.000 | 0.012 |
0.027 0.019 | 0.029 |
| 4 spectra, FSVSTFR | 0.000 | 0.000 | 0.000 | 0.508 | 0.451 | 0.000 | 0.000 | 0.041 | ||
| 5 spectra, AFVAMLDELLTEHK | 0.000 | 0.000 | 0.000 | 0.313 | 0.532 | 0.000 | 0.155 | 0.000 | ||
| 5 spectra, HFGLGK | 0.000 | 0.000 | 0.000 | 0.417 | 0.387 | 0.130 | 0.066 | 0.000 | ||
| 2 spectra, VTWDPAQPPR | 0.000 | 0.000 | 0.105 | 0.342 | 0.470 | 0.000 | 0.084 | 0.000 | ||
| 1 spectrum, YSEDTADRPPLHFNDQSGFGPR | 0.003 | 0.000 | 0.000 | 0.368 | 0.612 | 0.000 | 0.000 | 0.017 | ||
| 5 spectra, SQGVVLAR | 0.000 | 0.000 | 0.000 | 0.403 | 0.549 | 0.000 | 0.000 | 0.048 | ||
| 4 spectra, FADILPLGVPHK | 0.097 | 0.000 | 0.000 | 0.106 | 0.689 | 0.108 | 0.000 | 0.000 | ||
| 5 spectra, SLEQWVTEEAR | 0.000 | 0.000 | 0.000 | 0.465 | 0.504 | 0.000 | 0.000 | 0.032 |
| Plot | Mito | Lyso or Perox | ER | Golgi | PM | Cytosol | Nucleus | ||||||
| Expt B |
7 peptides |
21 spectra |
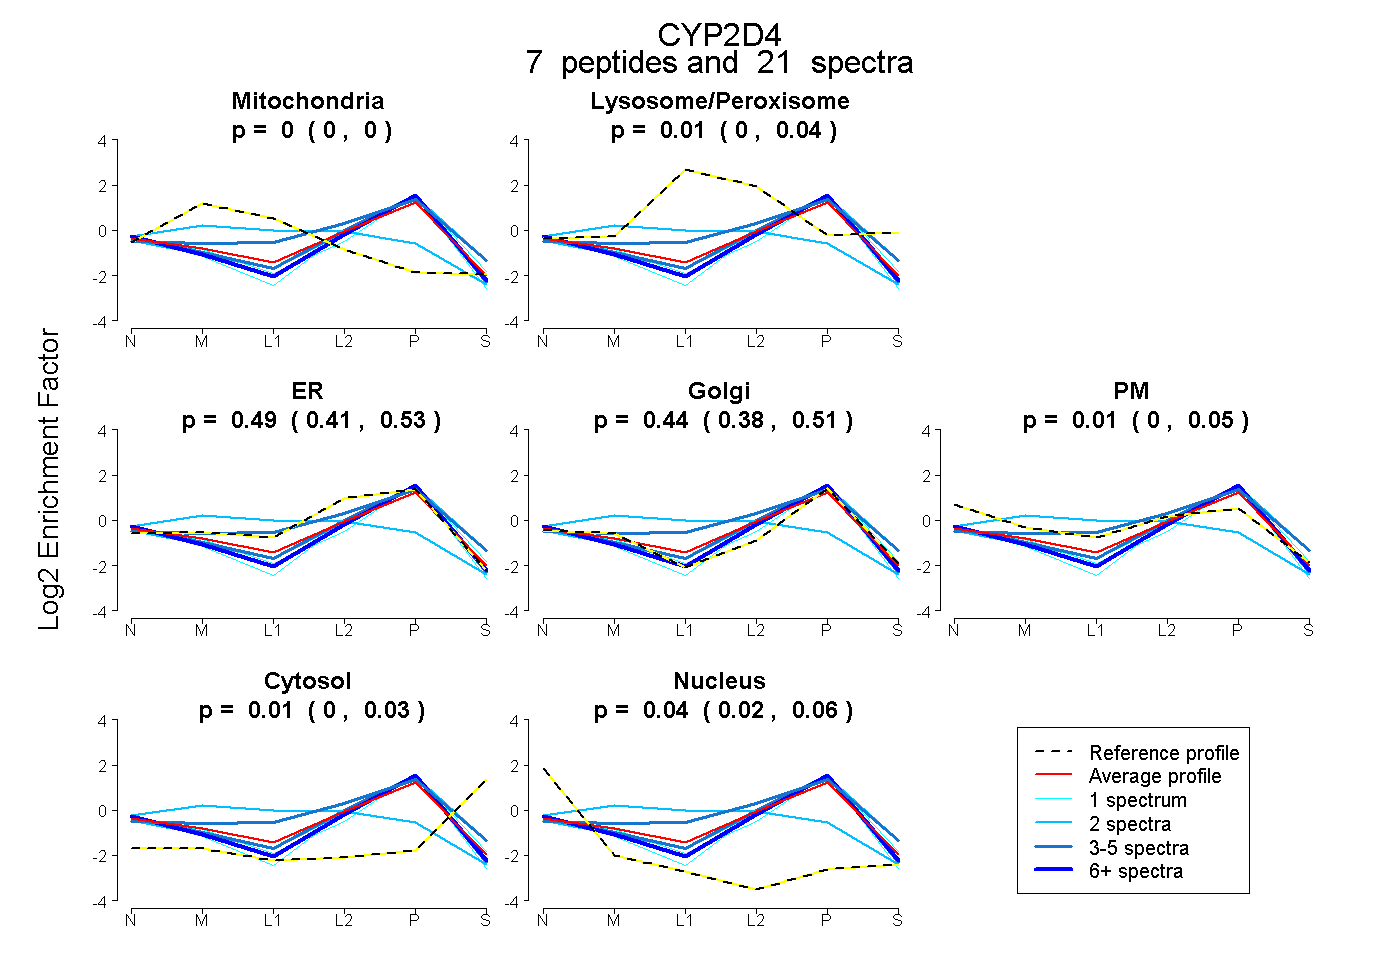 |
0.000 0.000 | 0.000 |
0.007 0.000 | 0.038 |
0.487 0.405 | 0.530 |
0.443 0.376 | 0.506 |
0.009 0.000 | 0.054 |
0.011 0.000 | 0.028 |
0.044 0.016 | 0.061 |
|||
| Plot | Lyso | Other | |||||||||||
| Expt C |
10 peptides |
95 spectra |
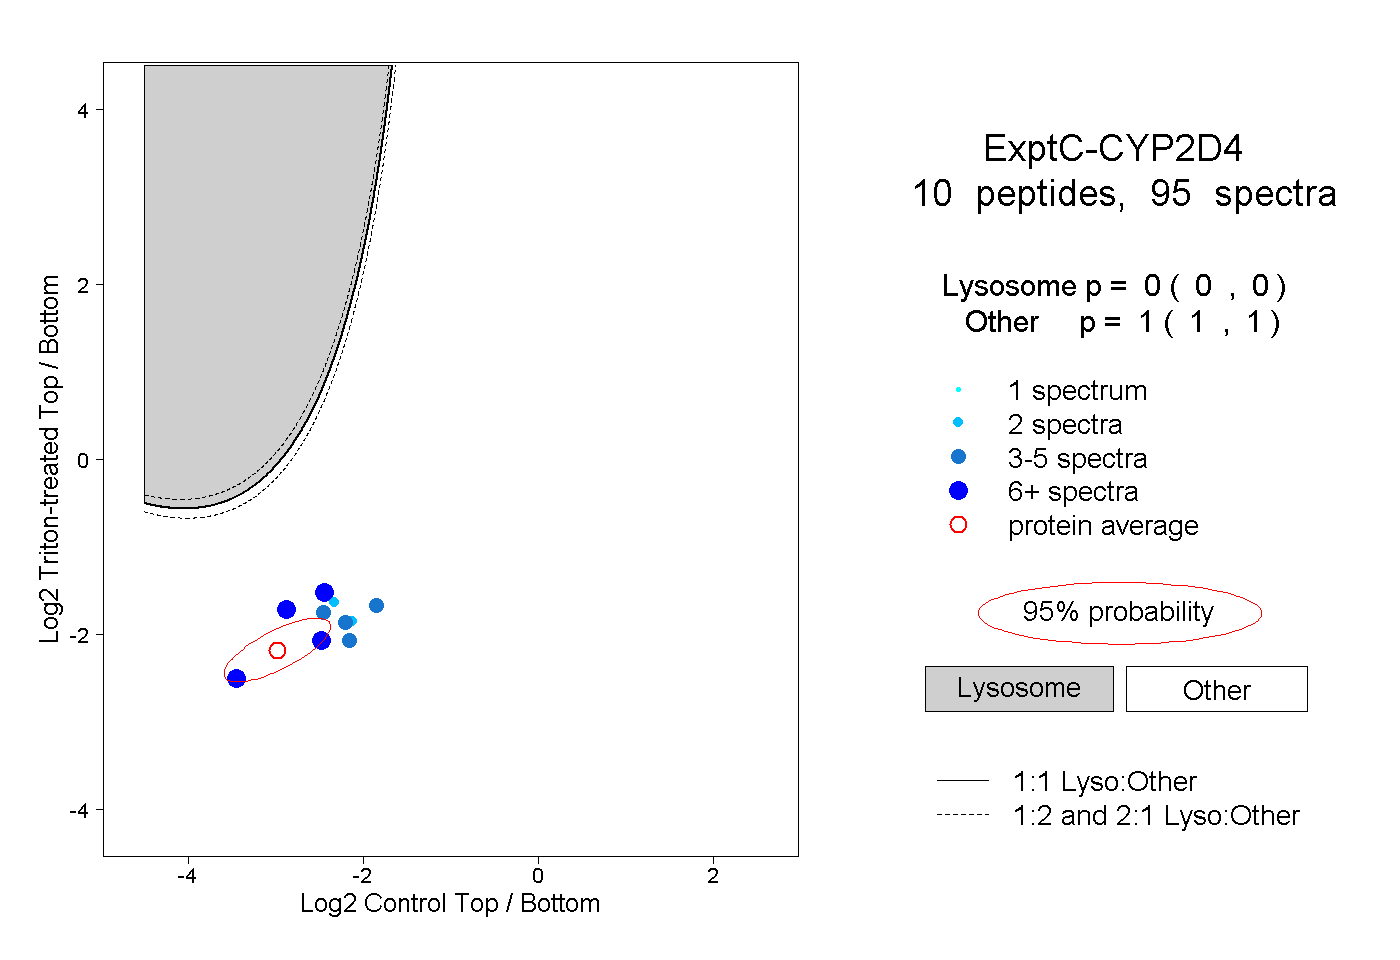 |
0.000 0.000 | 0.000 |
1.000 1.000 | 1.000 |
||||||||
| Plot | Lyso | Other | |||||||||||
| Expt D |
5 peptides |
15 spectra |
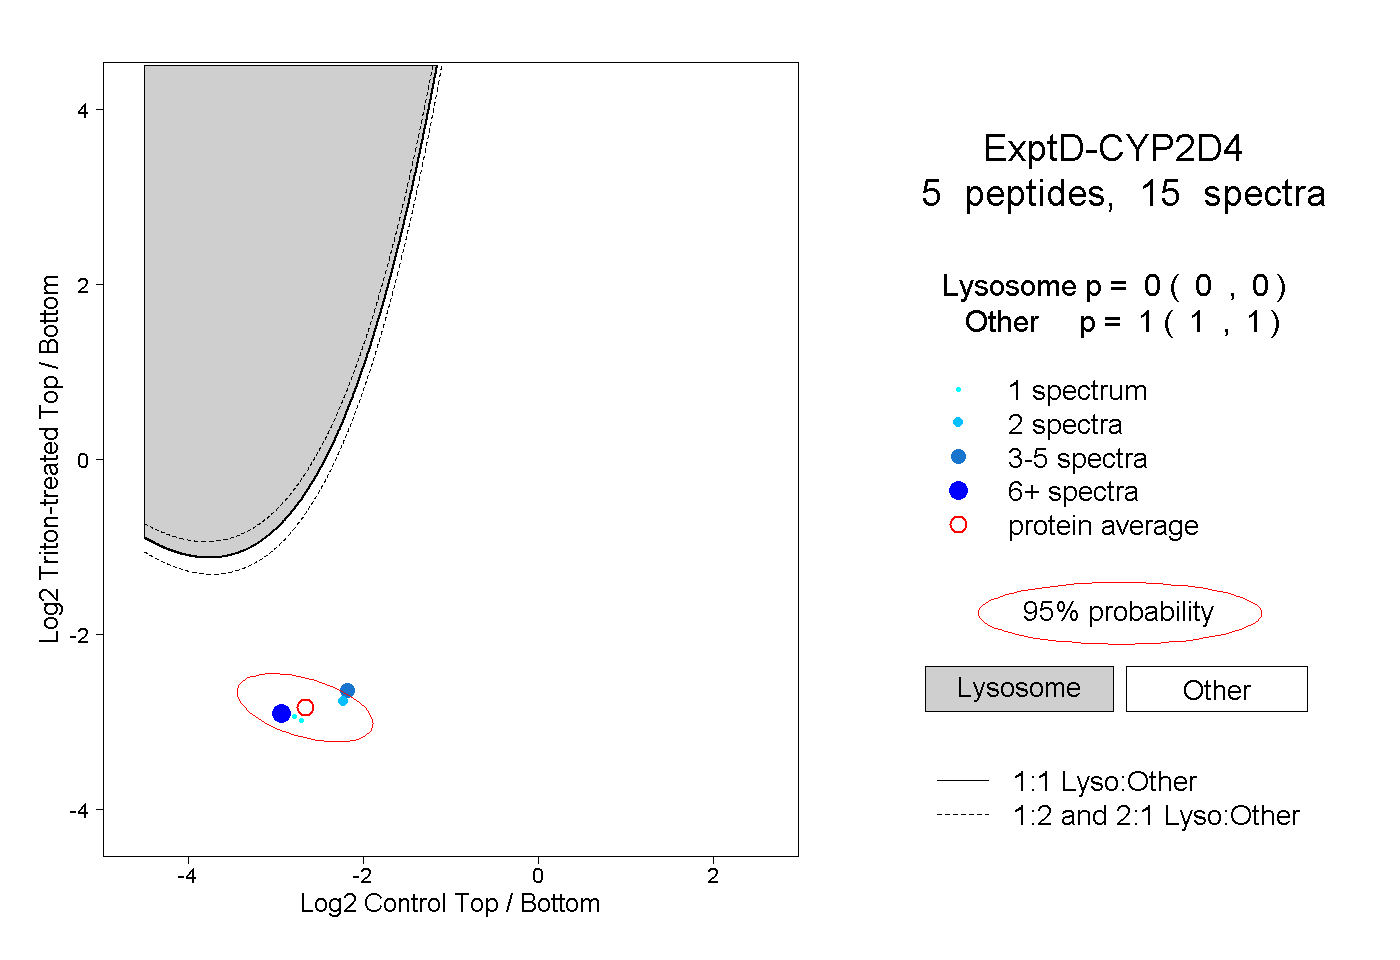 |
0.000 0.000 | 0.000 |
1.000 1.000 | 1.000 |