 2
2peptides
spectra
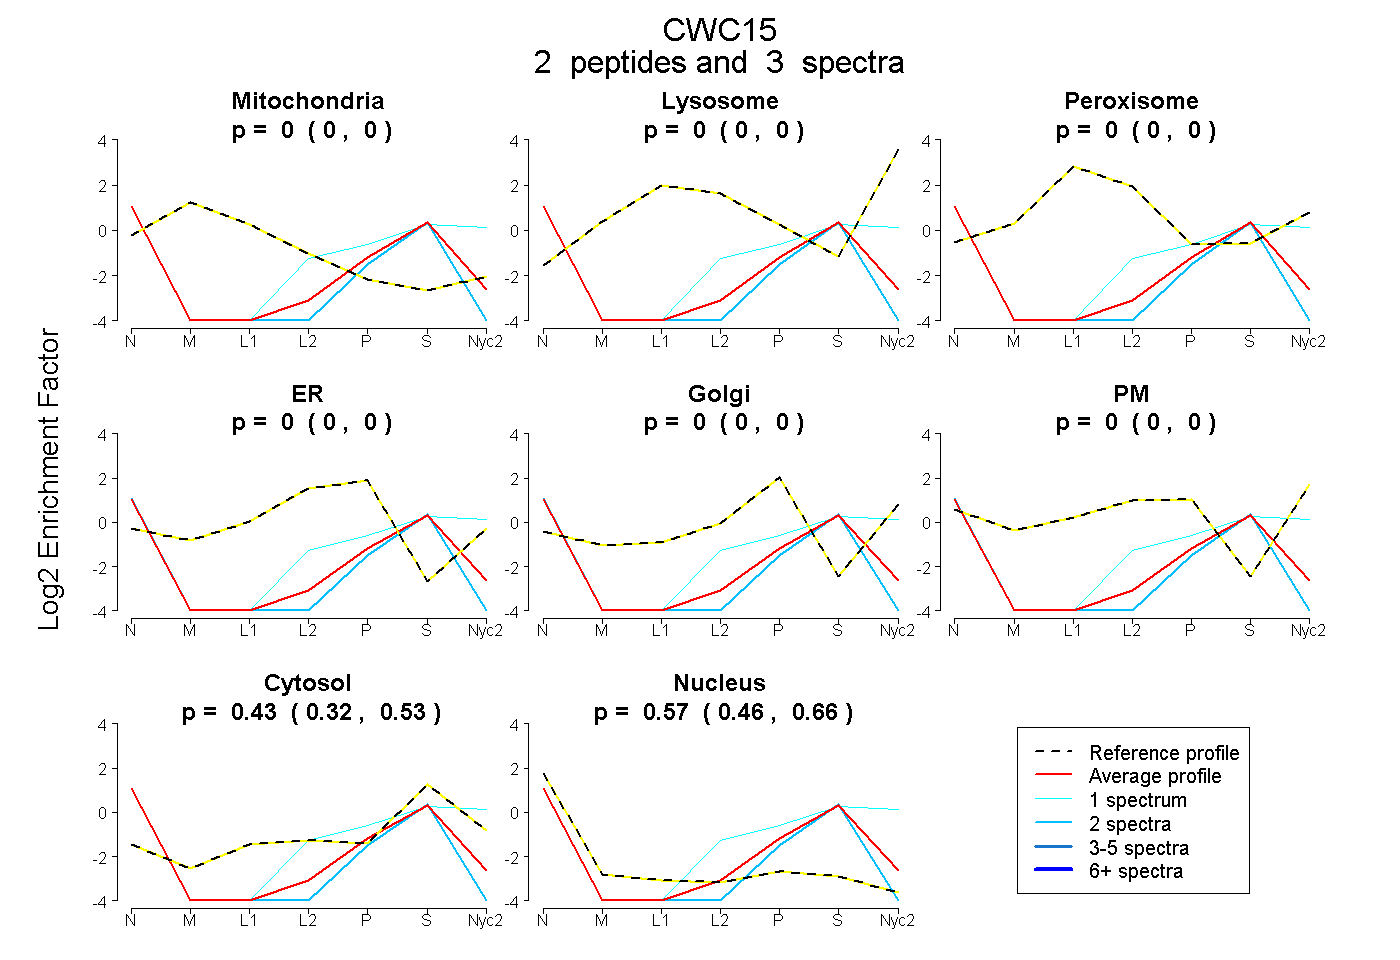
0.000 | 0.000
0.000 | 0.000
0.000 | 0.000
0.000 | 0.000
0.000 | 0.000
0.000 | 0.000
0.321 | 0.527
0.460 | 0.660
| Plot | Mito | Lyso | Perox | ER | Golgi | PM | Cytosol | Nucleus | |||||
| Expt A |
2 peptides |
3 spectra |
|
0.000 0.000 | 0.000 |
0.000 0.000 | 0.000 |
0.000 0.000 | 0.000 |
0.000 0.000 | 0.000 |
0.000 0.000 | 0.000 |
0.000 0.000 | 0.000 |
0.431 0.321 | 0.527 |
0.569 0.460 | 0.660 |
| 2 spectra, QTTQDAPEEVR | 0.000 | 0.000 | 0.000 | 0.000 | 0.000 | 0.000 | 0.295 | 0.705 | ||
| 1 spectrum, DLPSHTK | 0.000 | 0.000 | 0.000 | 0.000 | 0.156 | 0.000 | 0.569 | 0.274 |