10
10peptides
spectra
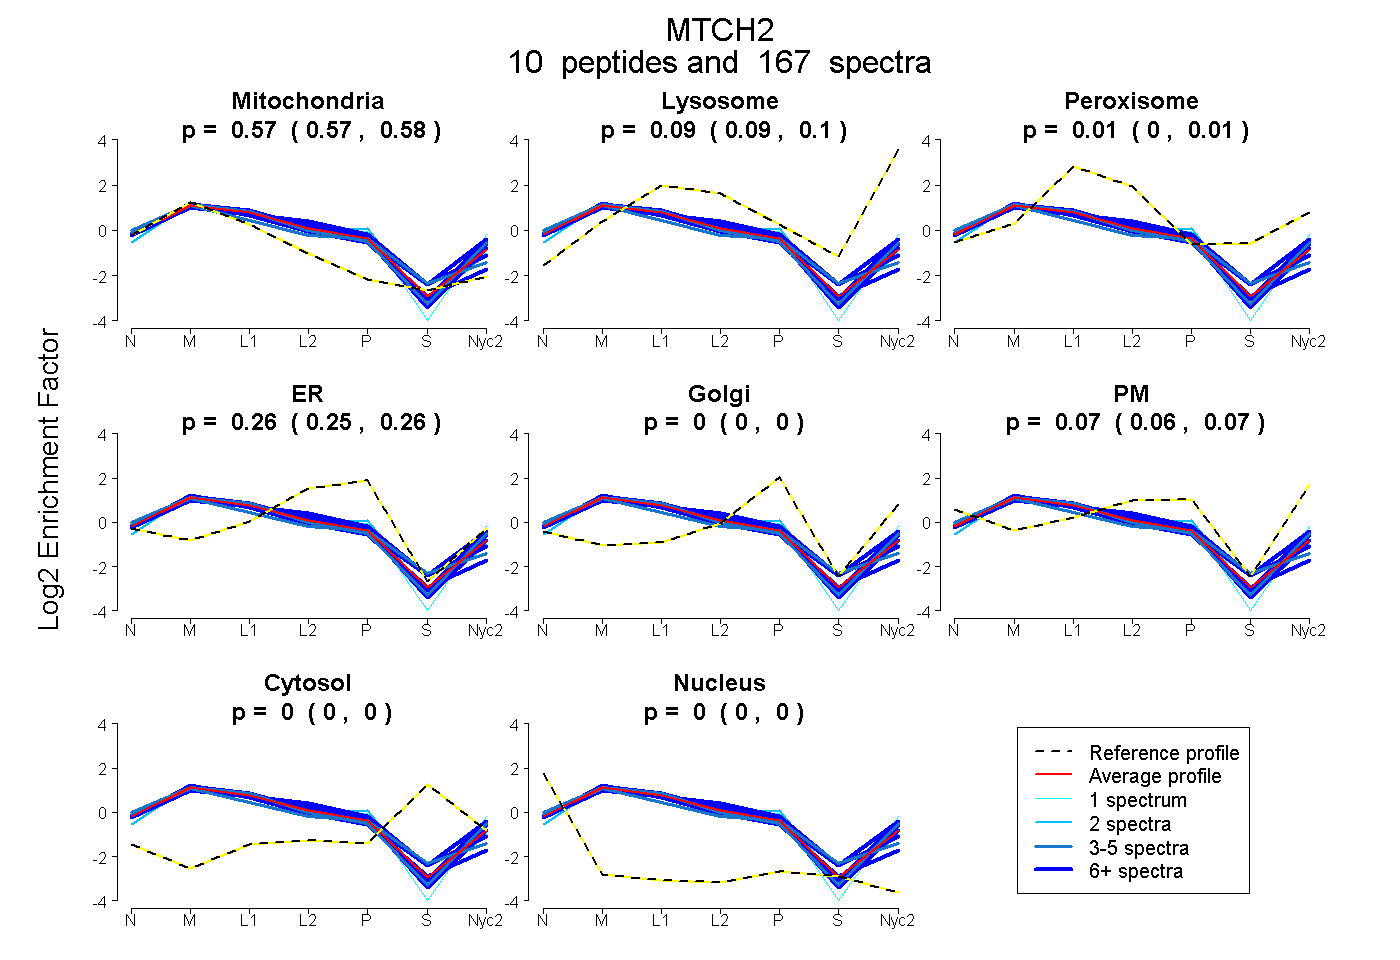
0.572 | 0.576
0.088 | 0.096
0.003 | 0.013
0.254 | 0.264
0.000 | 0.000
0.060 | 0.070
0.000 | 0.000
0.000 | 0.000
7peptides
spectra
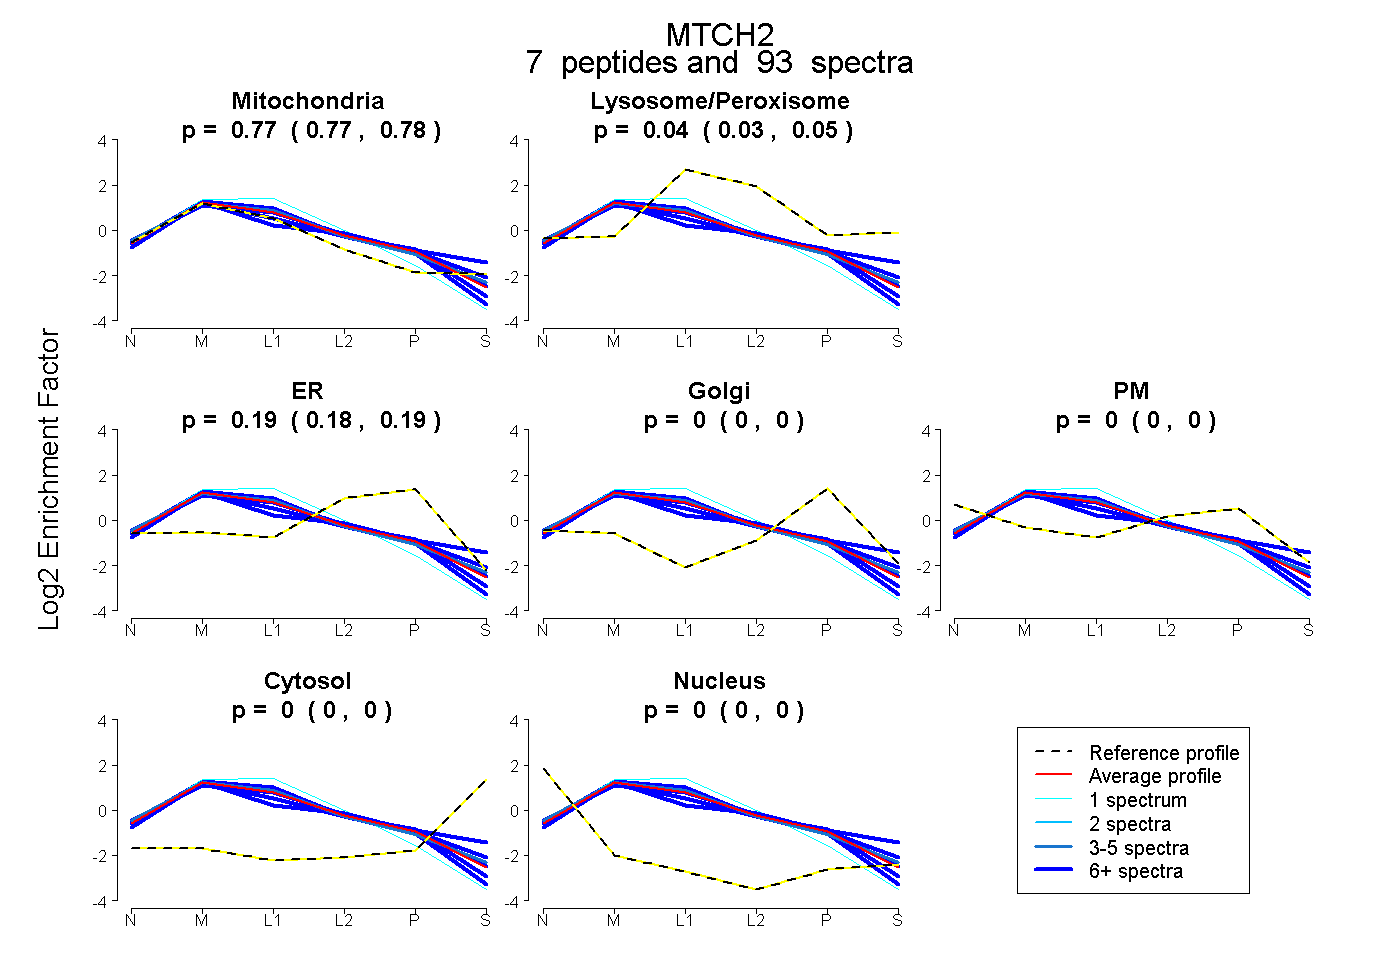
0.770 | 0.775
0.031 | 0.046
0.182 | 0.193
0.000 | 0.000
0.000 | 0.000
0.000 | 0.000
0.000 | 0.000