 10
10peptides
spectra
0.572 | 0.576
0.088 | 0.096
0.003 | 0.013
0.254 | 0.264
0.000 | 0.000
0.060 | 0.070
0.000 | 0.000
0.000 | 0.000
| Plot | Mito | Lyso | Perox | ER | Golgi | PM | Cytosol | Nucleus | |||||
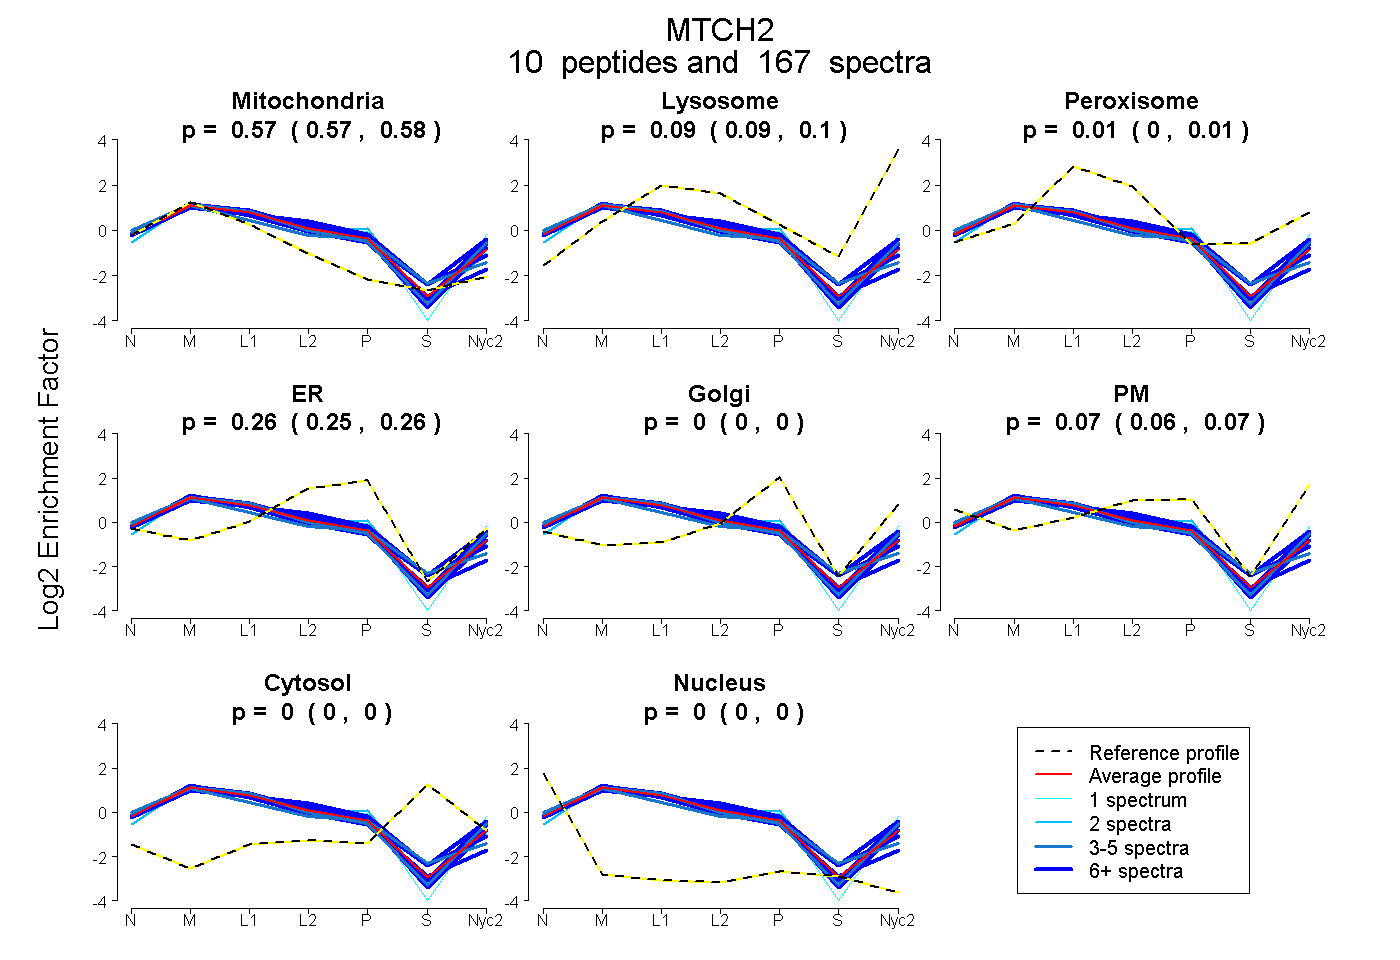
| Expt A |
10 peptides |
167 spectra |
|
0.574 0.572 | 0.576 |
0.092 0.088 | 0.096 |
0.009 0.003 | 0.013 |
0.260 0.254 | 0.264 |
0.000 0.000 | 0.000 |
0.065 0.060 | 0.070 |
0.000 0.000 | 0.000 |
0.000 0.000 | 0.000 |
| 35 spectra, GNSLFFR | 0.529 | 0.115 | 0.000 | 0.167 | 0.000 | 0.190 | 0.000 | 0.000 | ||
| 4 spectra, YCGLCDSIVTIYR | 0.626 | 0.000 | 0.059 | 0.310 | 0.005 | 0.000 | 0.000 | 0.000 | ||
| 2 spectra, AGNMSR | 0.546 | 0.081 | 0.000 | 0.373 | 0.000 | 0.000 | 0.000 | 0.000 | ||
| 57 spectra, SMVQFIGR | 0.564 | 0.126 | 0.000 | 0.216 | 0.000 | 0.093 | 0.000 | 0.000 | ||
| 26 spectra, GLFTGLTPR | 0.577 | 0.065 | 0.000 | 0.248 | 0.000 | 0.110 | 0.000 | 0.000 | ||
| 4 spectra, VLIQVGYEPLPPTIGR | 0.570 | 0.056 | 0.000 | 0.103 | 0.000 | 0.271 | 0.000 | 0.000 | ||
| 10 spectra, LCSGVLGTVVHGK | 0.494 | 0.000 | 0.153 | 0.353 | 0.000 | 0.000 | 0.000 | 0.000 | ||
| 7 spectra, TYYCDLR | 0.676 | 0.000 | 0.021 | 0.303 | 0.000 | 0.000 | 0.000 | 0.000 | ||
| 21 spectra, EYPSSFDR | 0.519 | 0.098 | 0.097 | 0.104 | 0.000 | 0.182 | 0.000 | 0.000 | ||
| 1 spectrum, EEGIVGFFAGLIPR | 0.488 | 0.000 | 0.000 | 0.111 | 0.000 | 0.402 | 0.000 | 0.000 |
| Plot | Mito | Lyso or Perox | ER | Golgi | PM | Cytosol | Nucleus | ||||||
| Expt B |
7 peptides |
93 spectra |
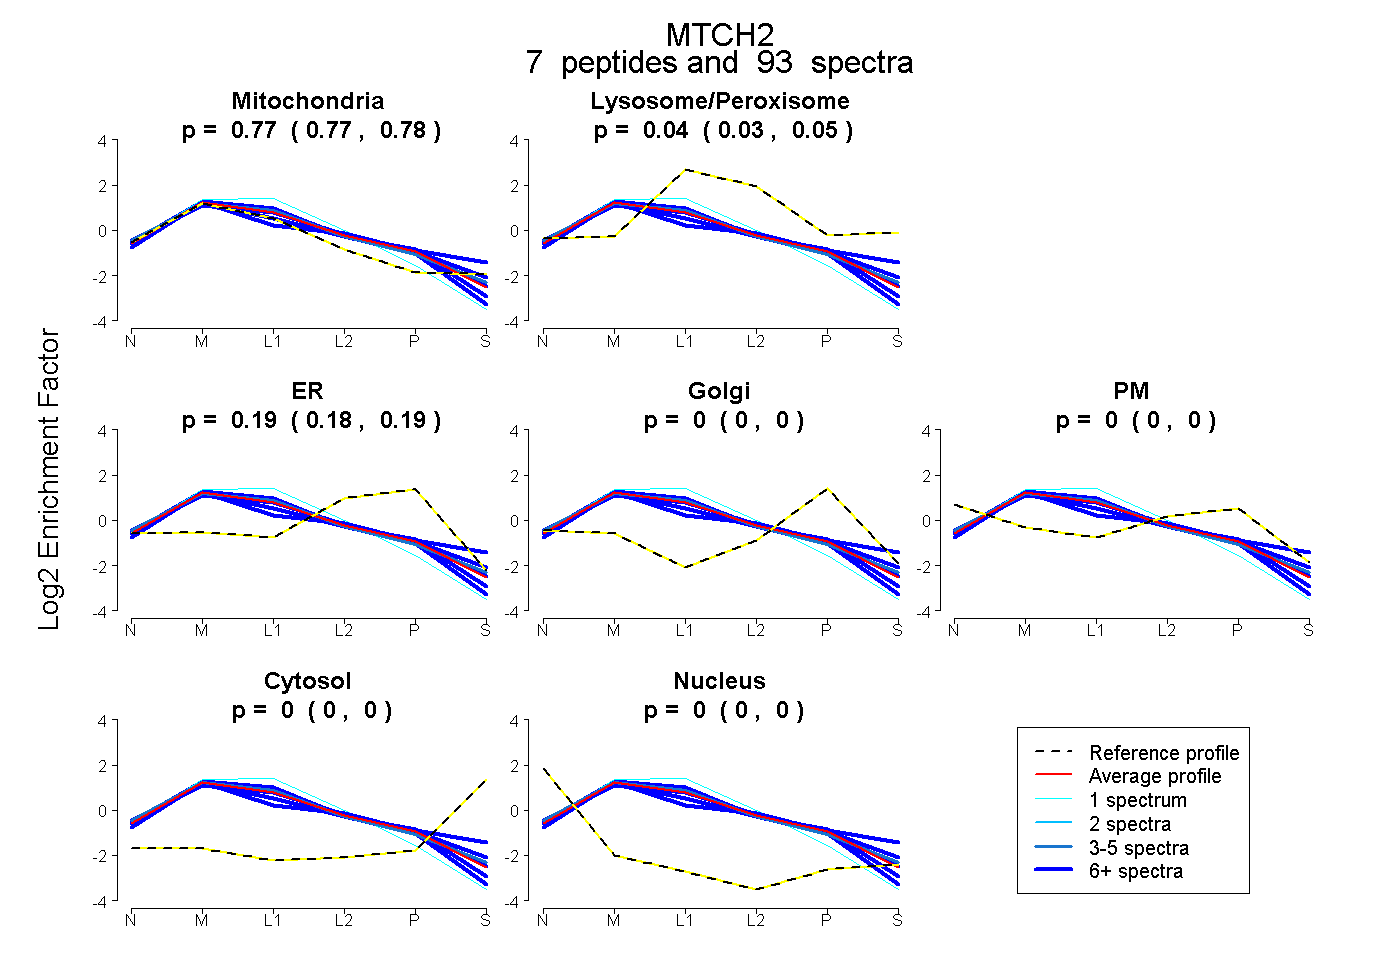 |
0.773 0.770 | 0.775 |
0.039 0.031 | 0.046 |
0.188 0.182 | 0.193 |
0.000 0.000 | 0.000 |
0.000 0.000 | 0.000 |
0.000 0.000 | 0.000 |
0.000 0.000 | 0.000 |
|||
| Plot | Lyso | Other | |||||||||||
| Expt C |
12 peptides |
393 spectra |
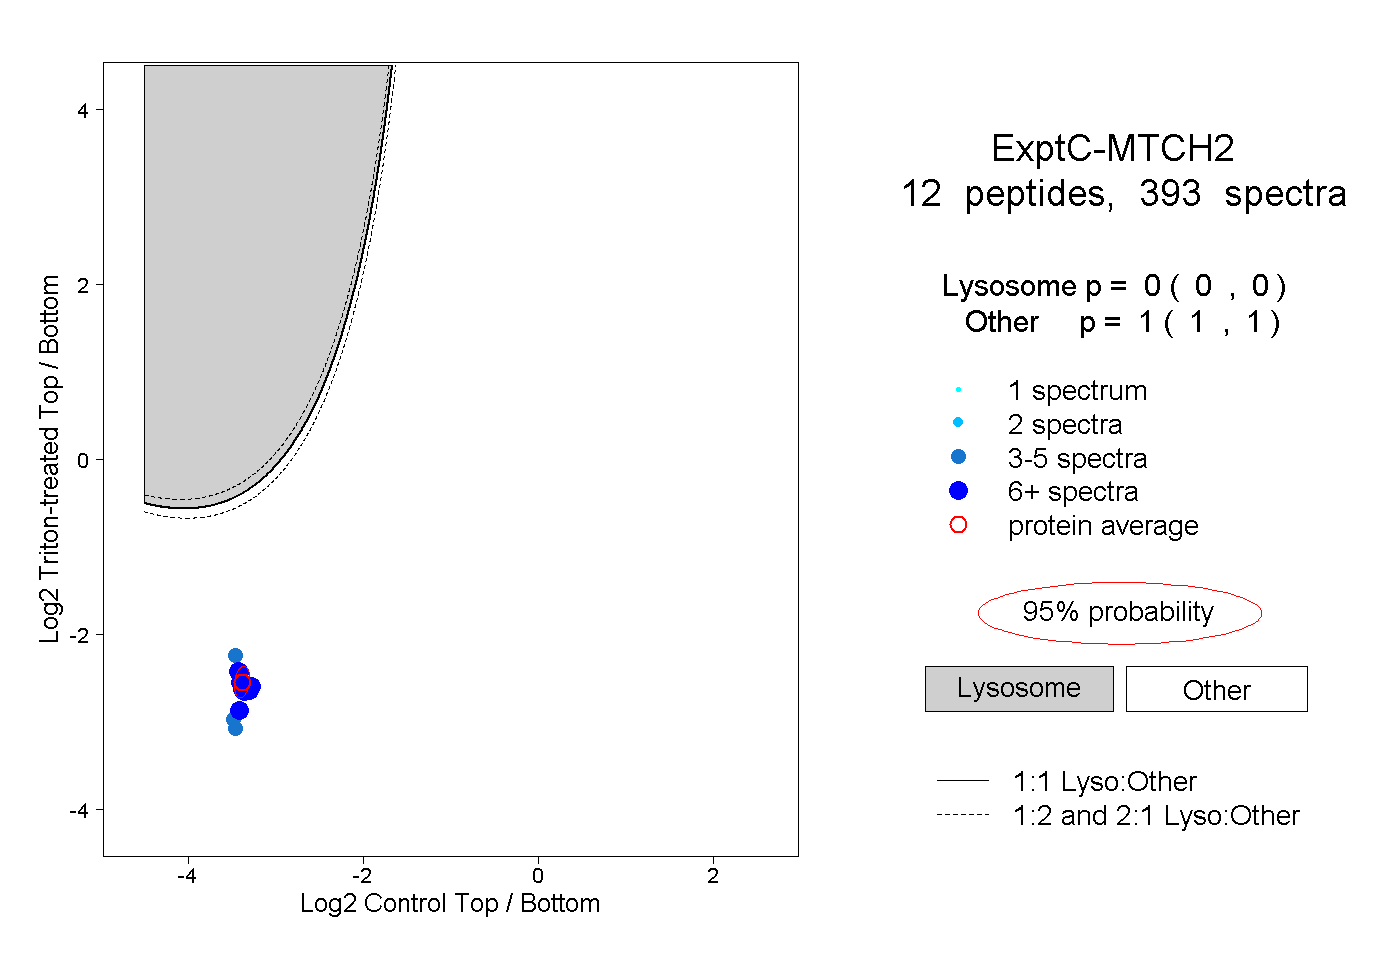 |
0.000 0.000 | 0.000 |
1.000 1.000 | 1.000 |
||||||||
| Plot | Lyso | Other | |||||||||||
| Expt D |
6 peptides |
37 spectra |
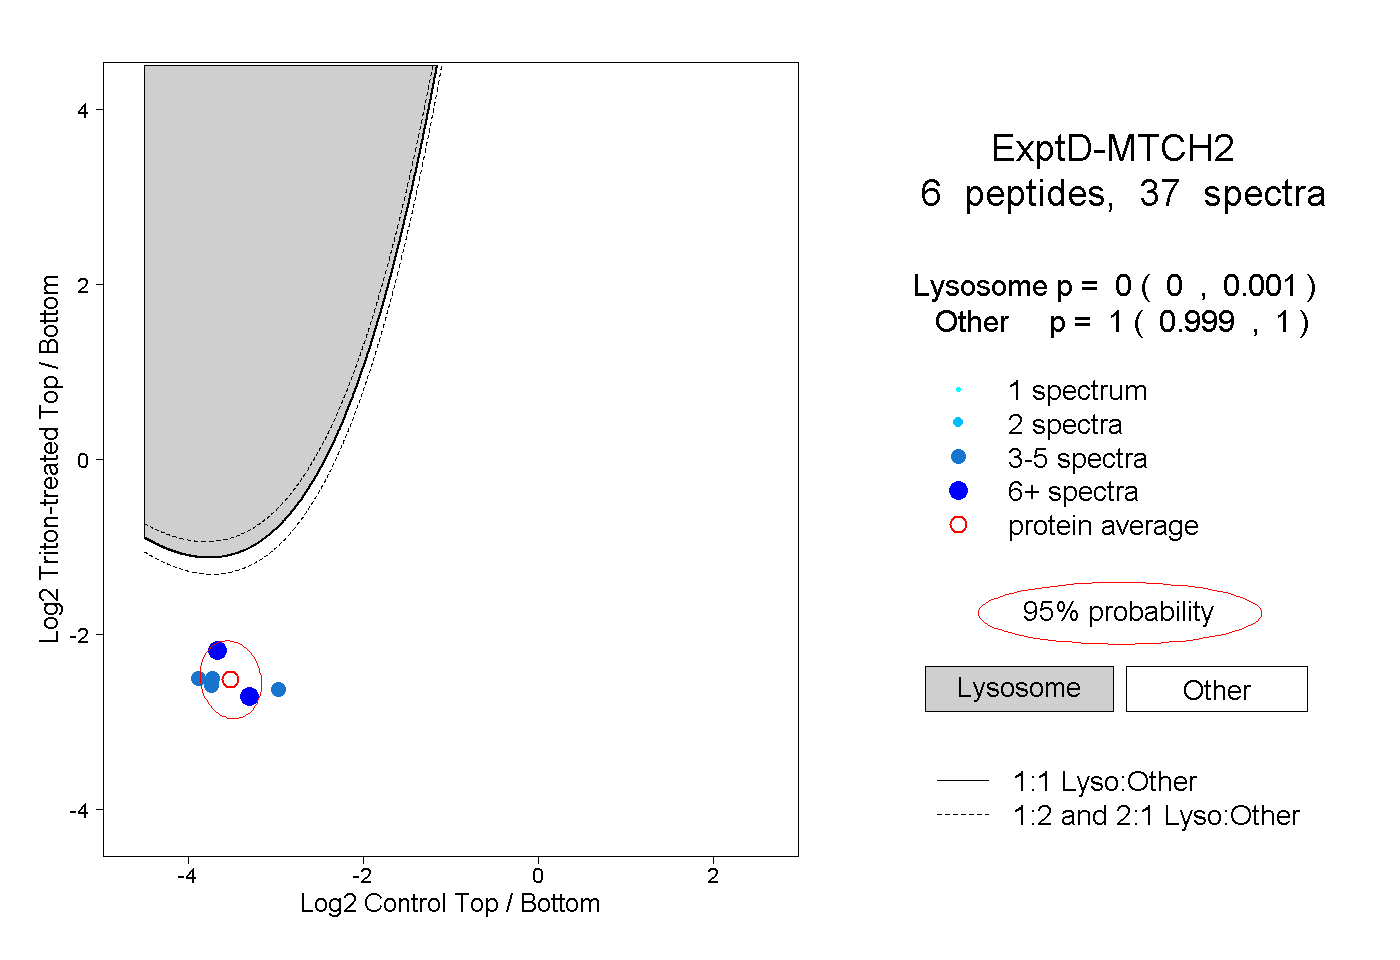 |
0.000 0.000 | 0.001 |
1.000 0.999 | 1.000 |