 3
3peptides
spectra
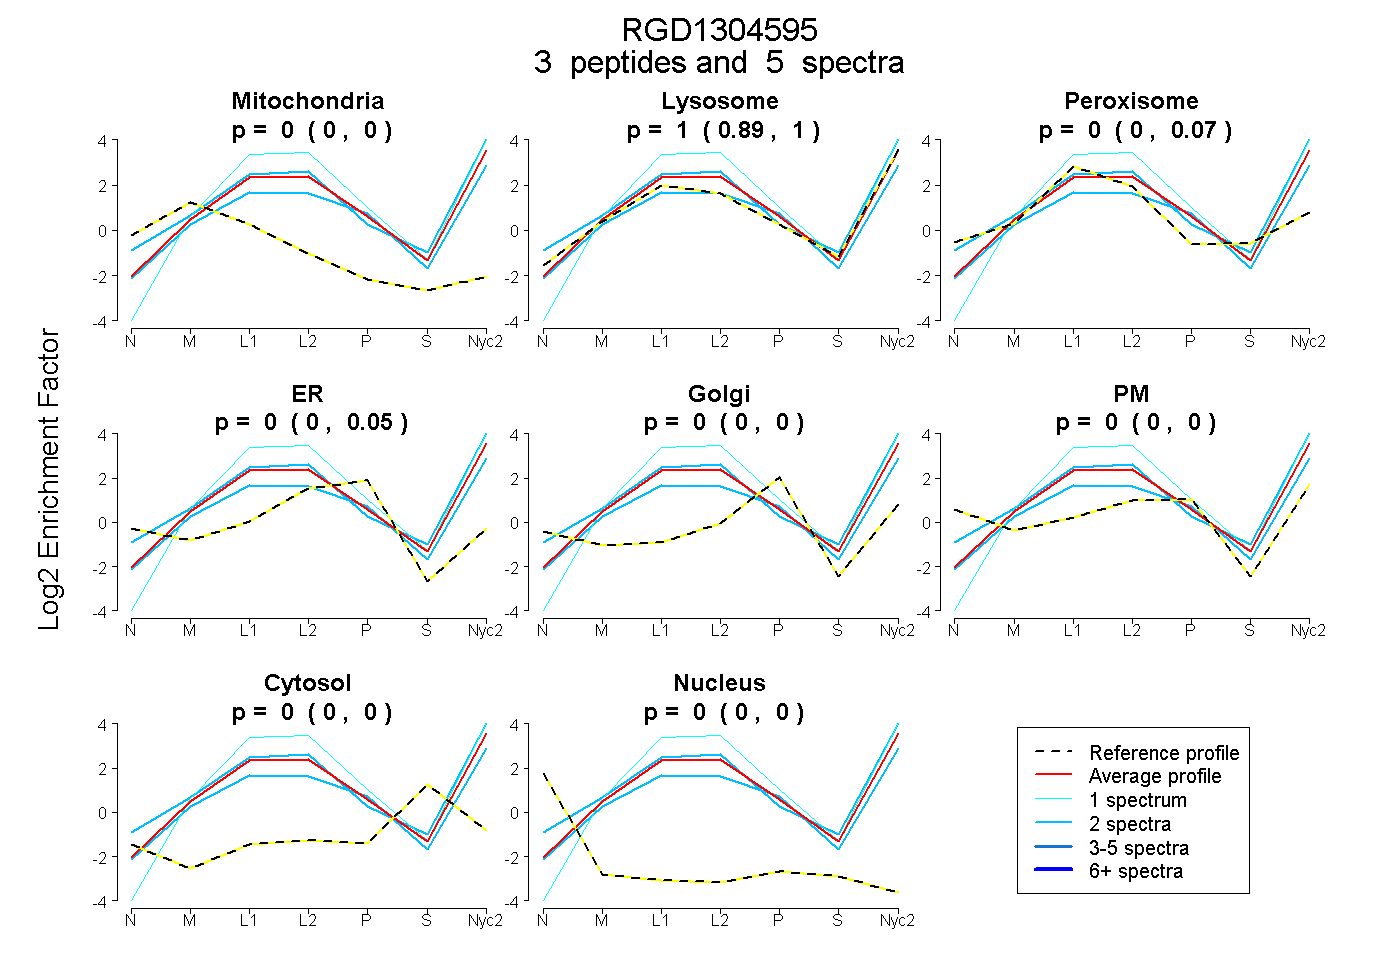
0.000 | 0.000
0.889 | 1.000
0.000 | 0.074
0.000 | 0.047
0.000 | 0.000
0.000 | 0.000
0.000 | 0.000
0.000 | 0.000
2peptides
spectra
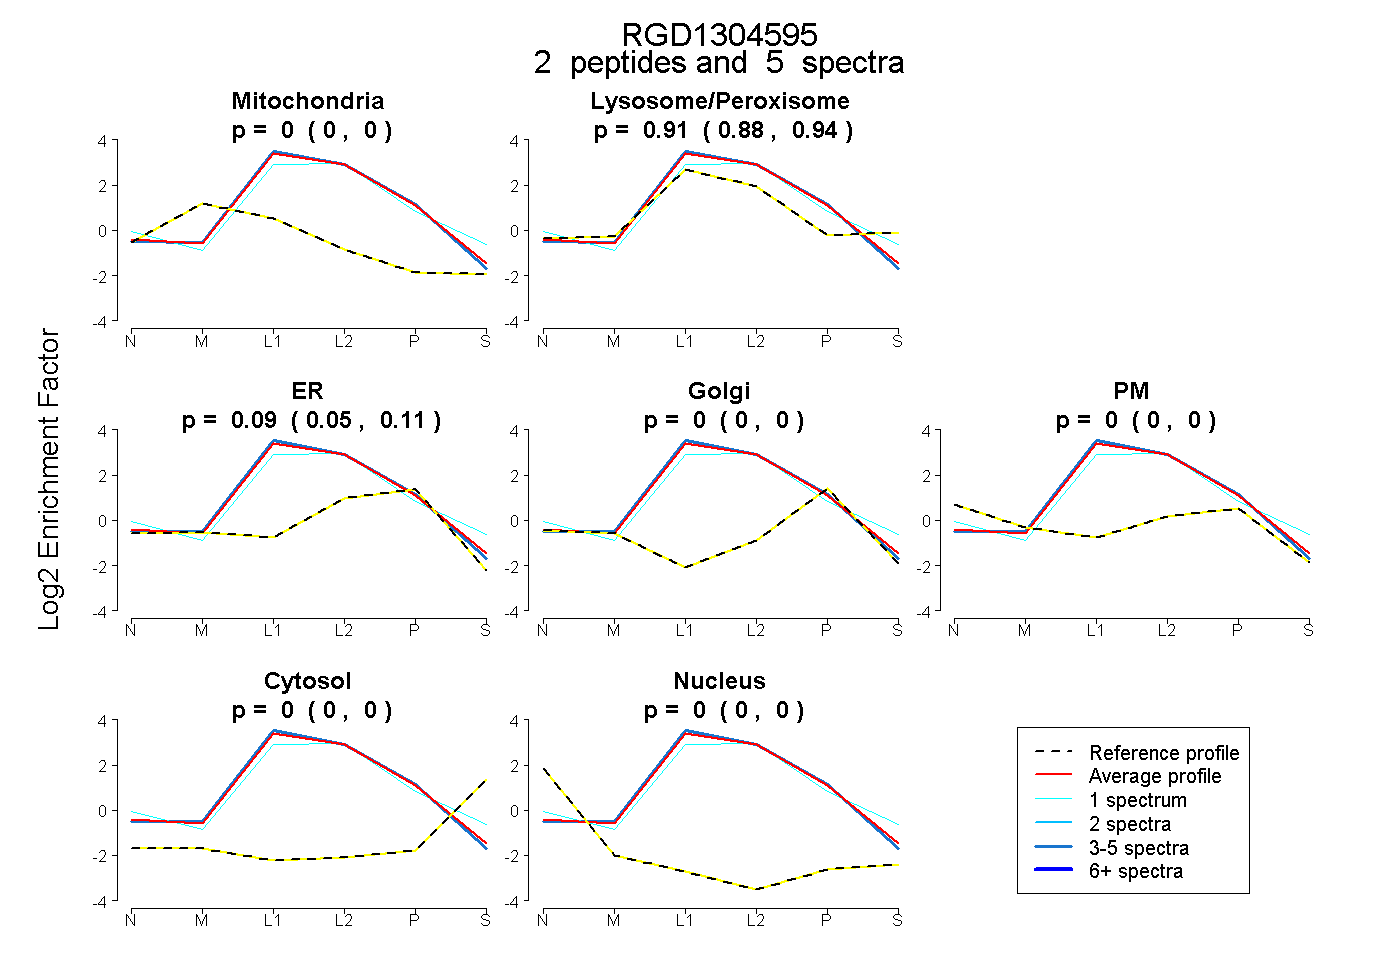
0.000 | 0.000
0.881 | 0.940
0.052 | 0.114
0.000 | 0.000
0.000 | 0.000
0.000 | 0.000
0.000 | 0.000
4peptides
spectra
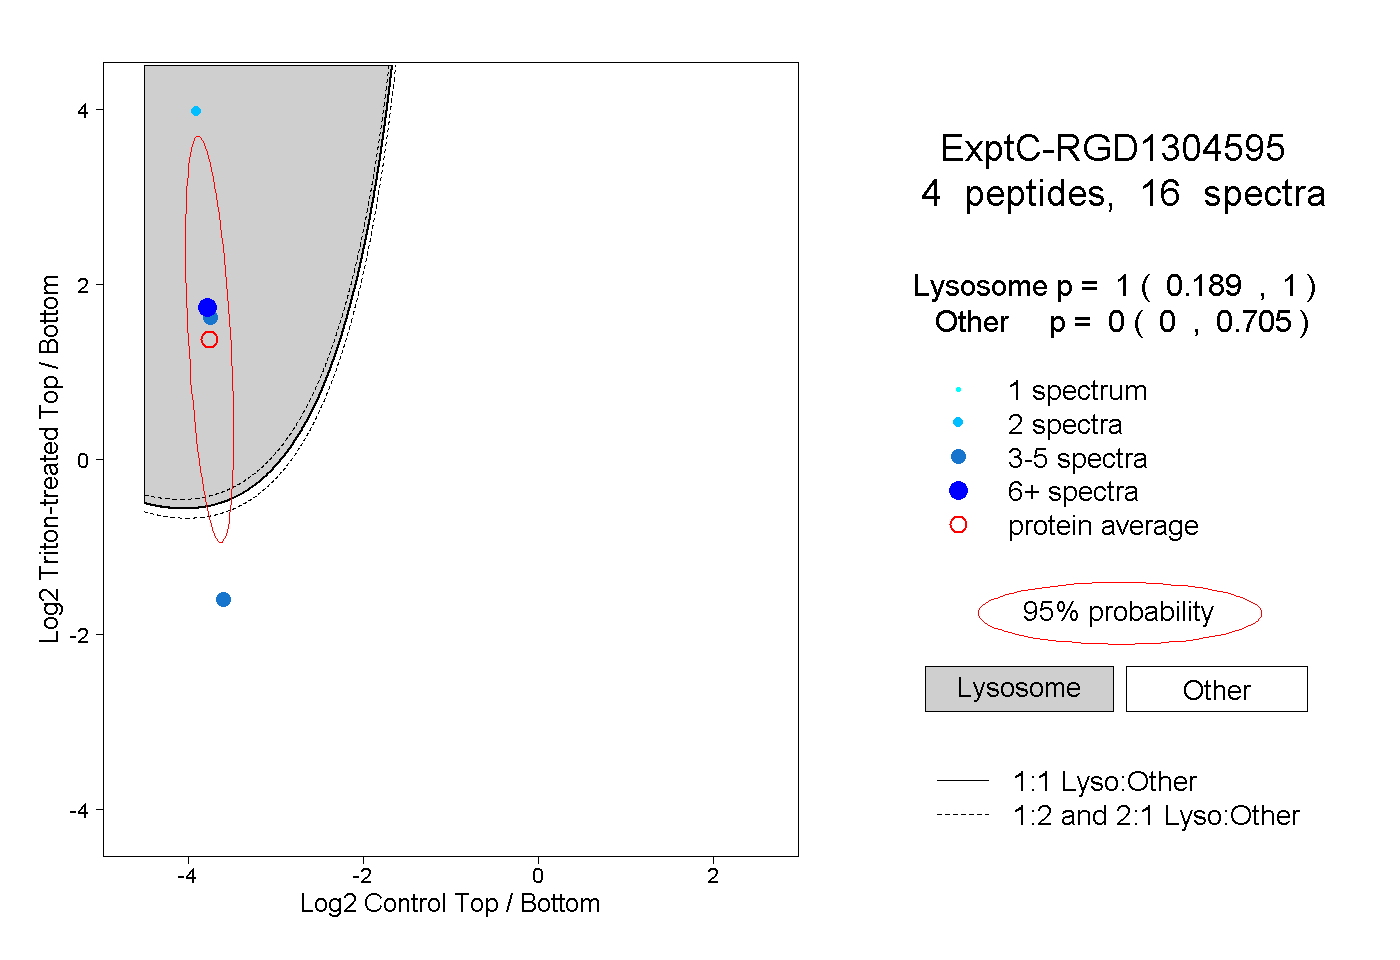
0.189 | 1.000
0.000 | 0.705
1peptide
spectrum
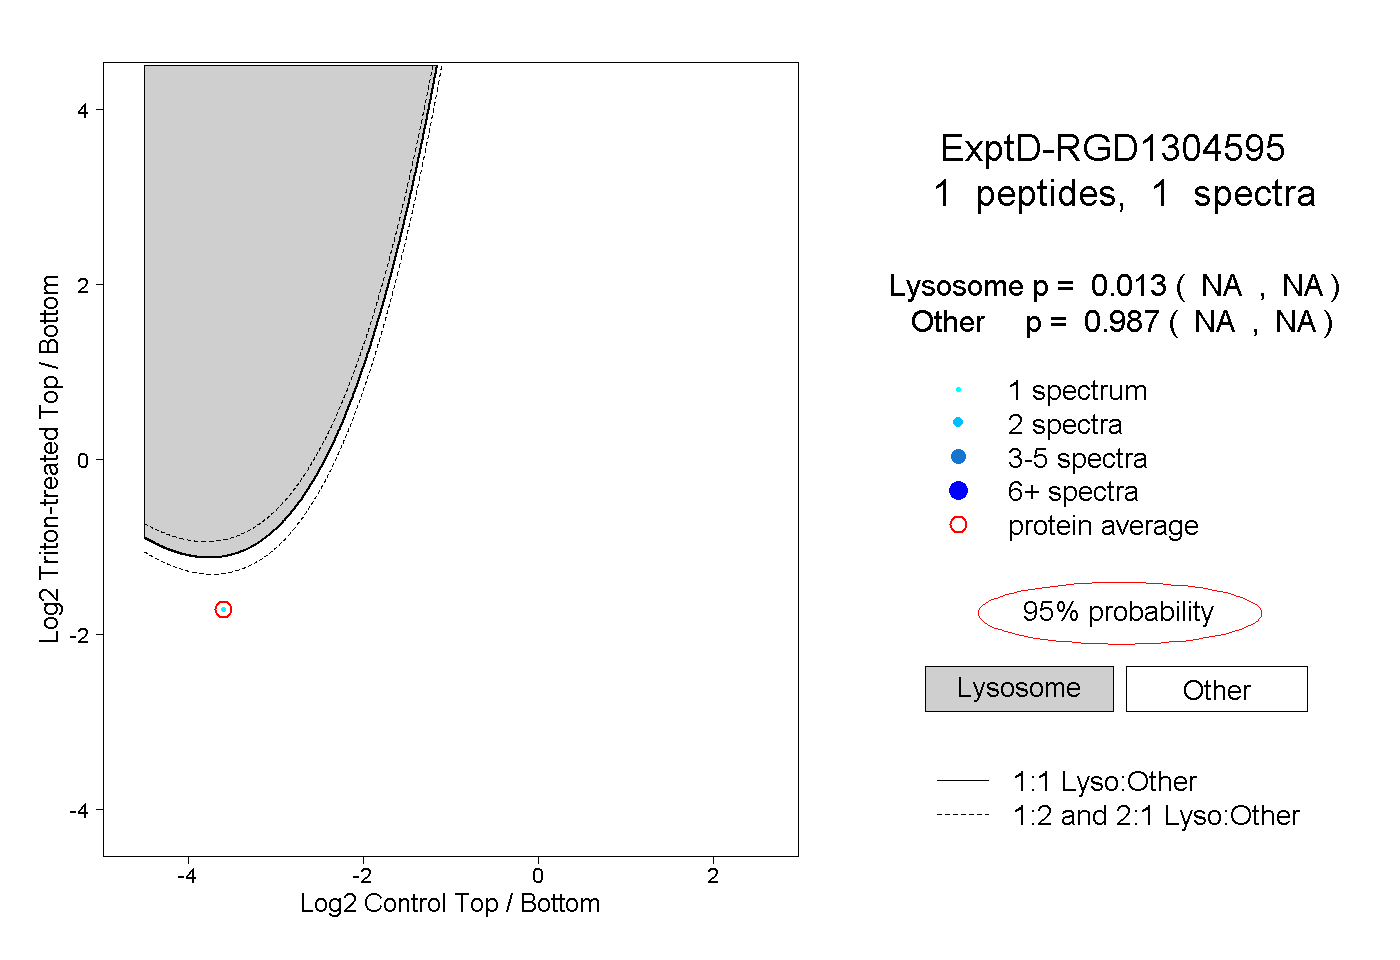
NA | NA
NA | NA