12
12peptides
spectra
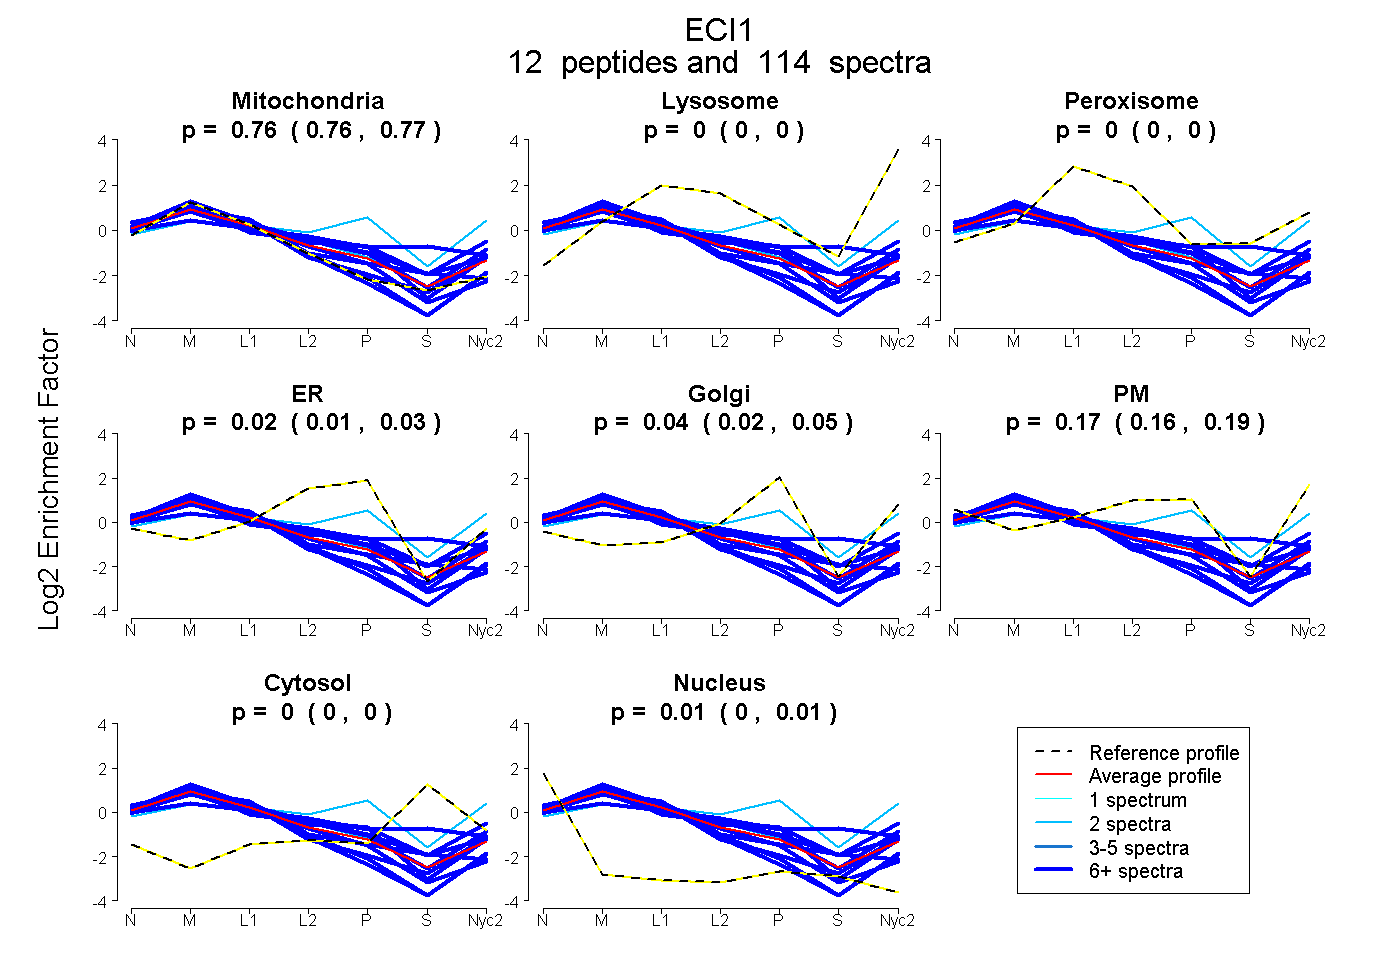
0.756 | 0.766
0.000 | 0.000
0.000 | 0.005
0.007 | 0.033
0.024 | 0.048
0.160 | 0.185
0.000 | 0.000
0.003 | 0.009
11peptides
spectra
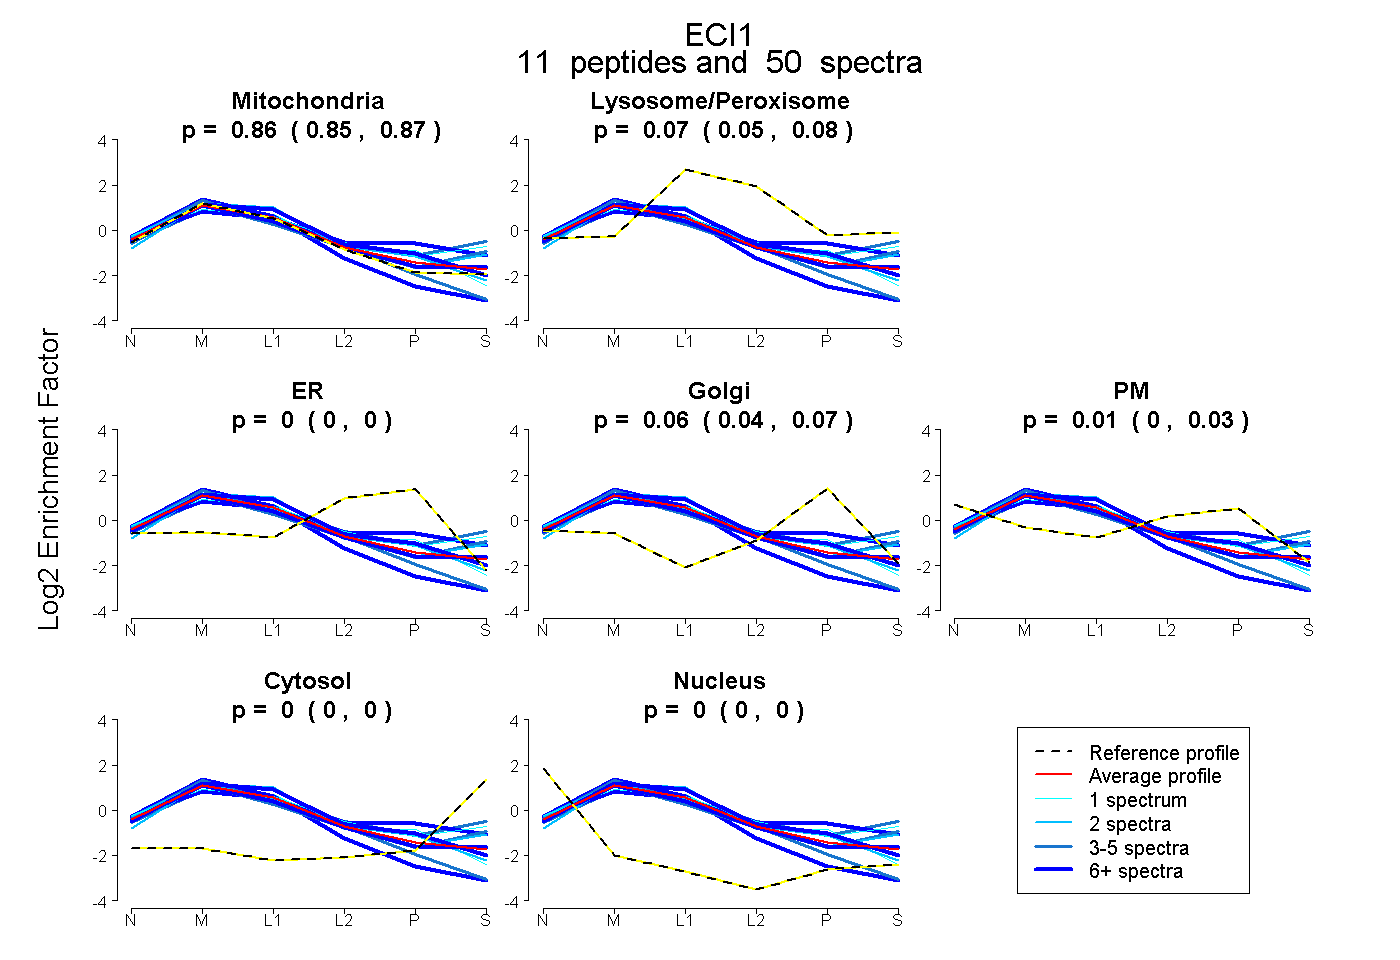
0.849 | 0.872
0.053 | 0.075
0.000 | 0.000
0.044 | 0.072
0.000 | 0.030
0.000 | 0.000
0.000 | 0.000
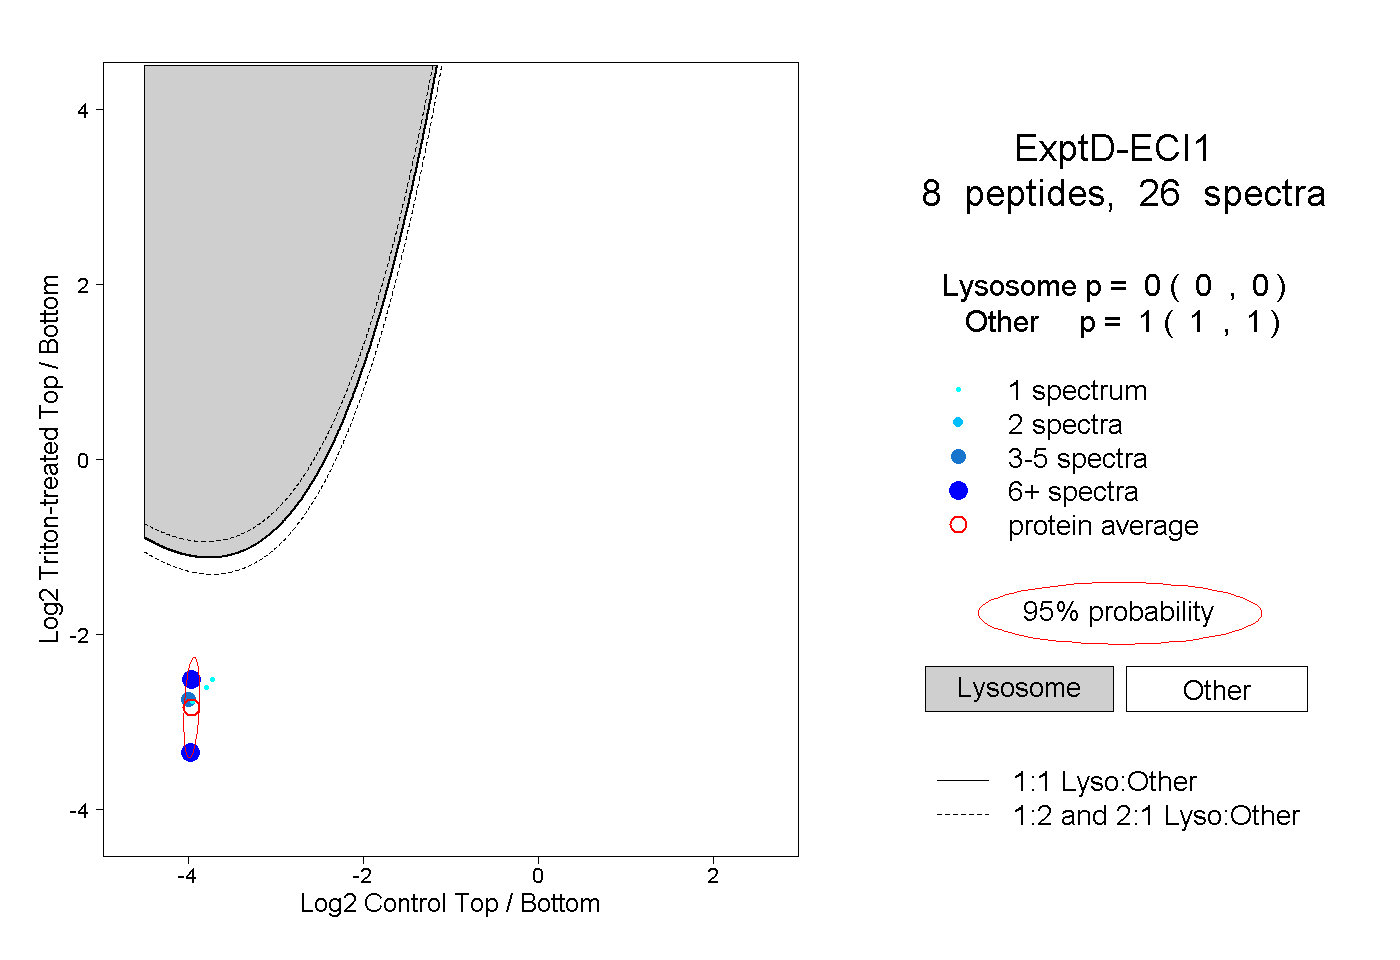
12peptides
spectra
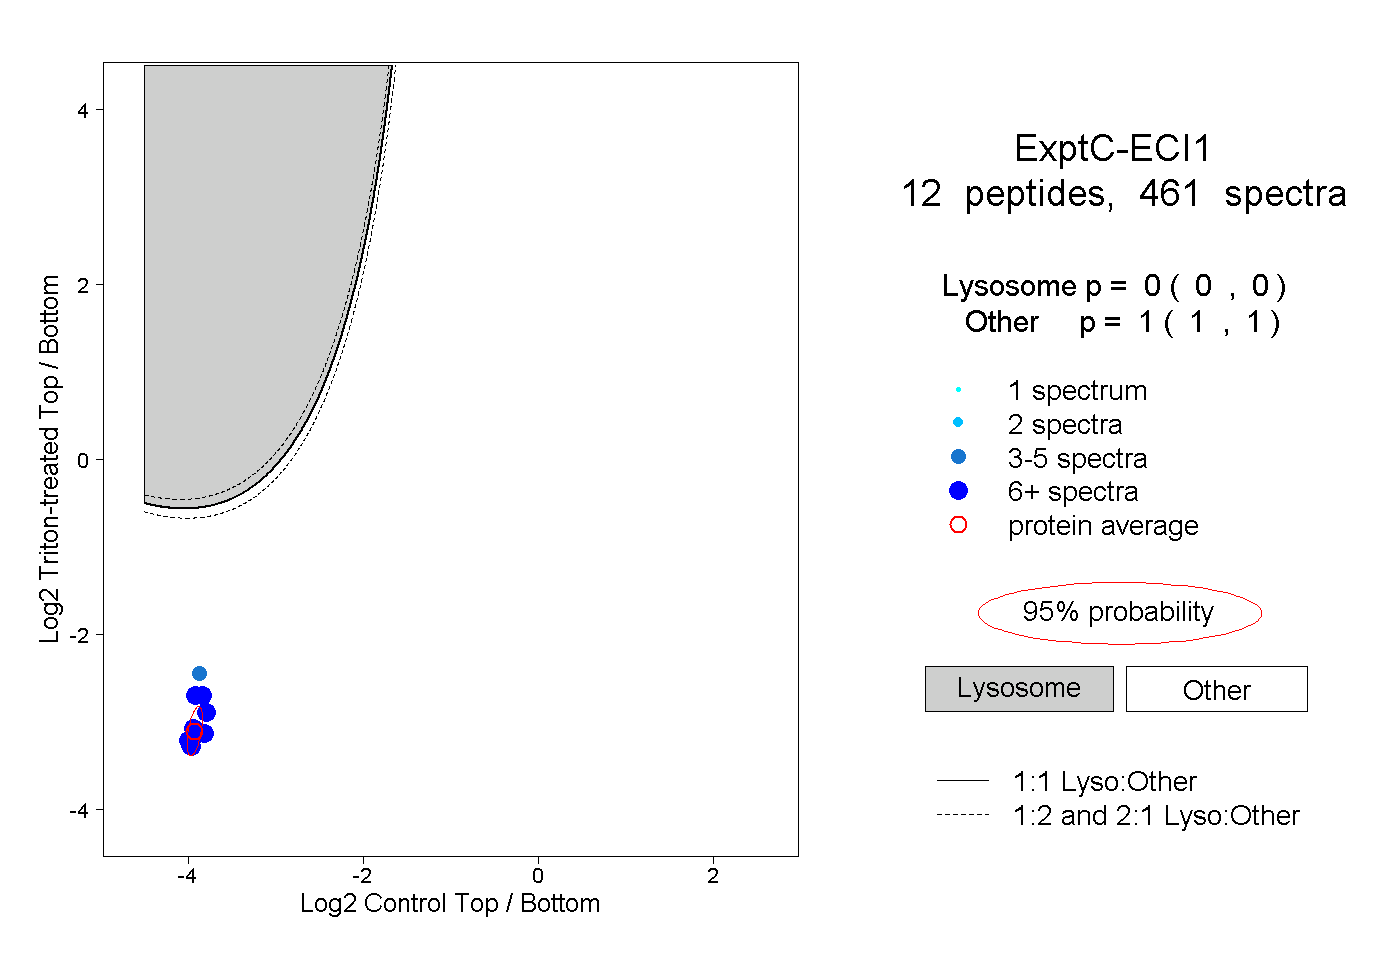
0.000 | 0.000
1.000 | 1.000