 12
12peptides
spectra
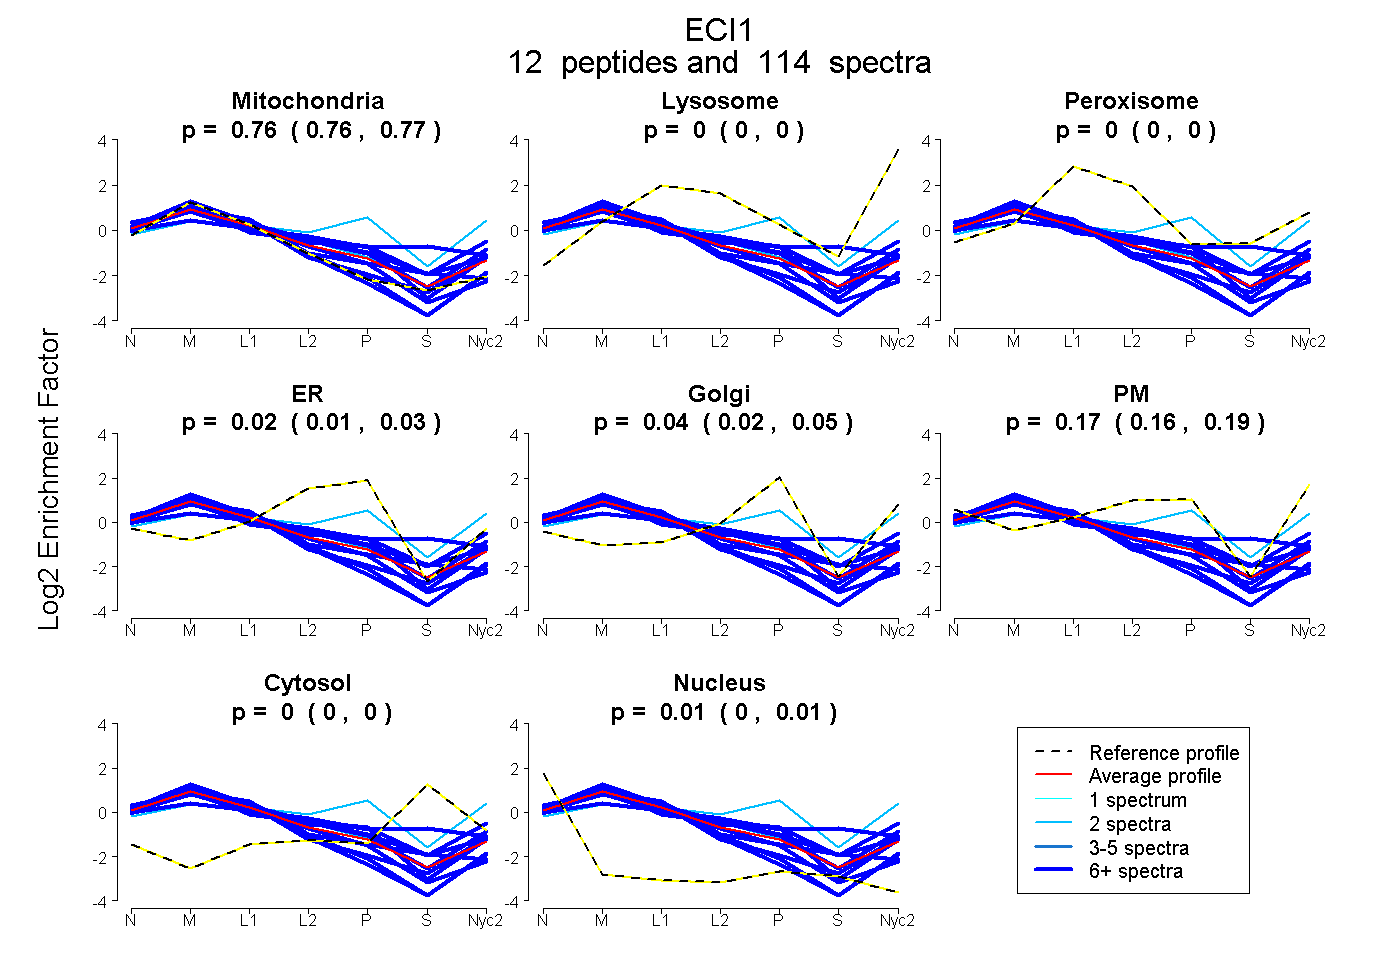
0.756 | 0.766
0.000 | 0.000
0.000 | 0.005
0.007 | 0.033
0.024 | 0.048
0.160 | 0.185
0.000 | 0.000
0.003 | 0.009
| Plot | Mito | Lyso | Perox | ER | Golgi | PM | Cytosol | Nucleus | |||||
| Expt A |
12 peptides |
114 spectra |
|
0.762 0.756 | 0.766 |
0.000 0.000 | 0.000 |
0.000 0.000 | 0.005 |
0.022 0.007 | 0.033 |
0.036 0.024 | 0.048 |
0.175 0.160 | 0.185 |
0.000 0.000 | 0.000 |
0.006 0.003 | 0.009 |
| 13 spectra, GVILTSERPGIFSAGLDLMEMYGR | 0.980 | 0.000 | 0.000 | 0.000 | 0.000 | 0.000 | 0.000 | 0.020 | ||
| 6 spectra, VGLVDEVVPEDQVHSK | 0.860 | 0.000 | 0.000 | 0.115 | 0.000 | 0.000 | 0.000 | 0.025 | ||
| 2 spectra, ALQLGTLFPPAEALK | 0.742 | 0.000 | 0.004 | 0.060 | 0.000 | 0.195 | 0.000 | 0.000 | ||
| 8 spectra, SLHVYLEK | 0.802 | 0.000 | 0.073 | 0.040 | 0.000 | 0.000 | 0.058 | 0.028 | ||
| 6 spectra, NPAHYAEYWK | 0.590 | 0.025 | 0.000 | 0.000 | 0.000 | 0.317 | 0.068 | 0.000 | ||
| 2 spectra, ATADNLIK | 0.257 | 0.095 | 0.133 | 0.000 | 0.408 | 0.086 | 0.022 | 0.000 | ||
| 10 spectra, EADIQNFTSFISR | 0.949 | 0.000 | 0.000 | 0.000 | 0.000 | 0.035 | 0.000 | 0.016 | ||
| 15 spectra, DNYVNTIGHR | 0.436 | 0.000 | 0.168 | 0.082 | 0.000 | 0.069 | 0.245 | 0.000 | ||
| 18 spectra, EGEAGIAVMK | 0.619 | 0.000 | 0.116 | 0.064 | 0.158 | 0.026 | 0.016 | 0.000 | ||
| 20 spectra, WFTIPDHSR | 0.692 | 0.000 | 0.000 | 0.000 | 0.068 | 0.240 | 0.000 | 0.000 | ||
| 6 spectra, AVQELWLR | 0.782 | 0.042 | 0.000 | 0.000 | 0.000 | 0.114 | 0.000 | 0.062 | ||
| 8 spectra, IMADNPK | 0.684 | 0.000 | 0.000 | 0.112 | 0.101 | 0.103 | 0.000 | 0.000 |
| Plot | Mito | Lyso or Perox | ER | Golgi | PM | Cytosol | Nucleus | ||||||
| Expt B |
11 peptides |
50 spectra |
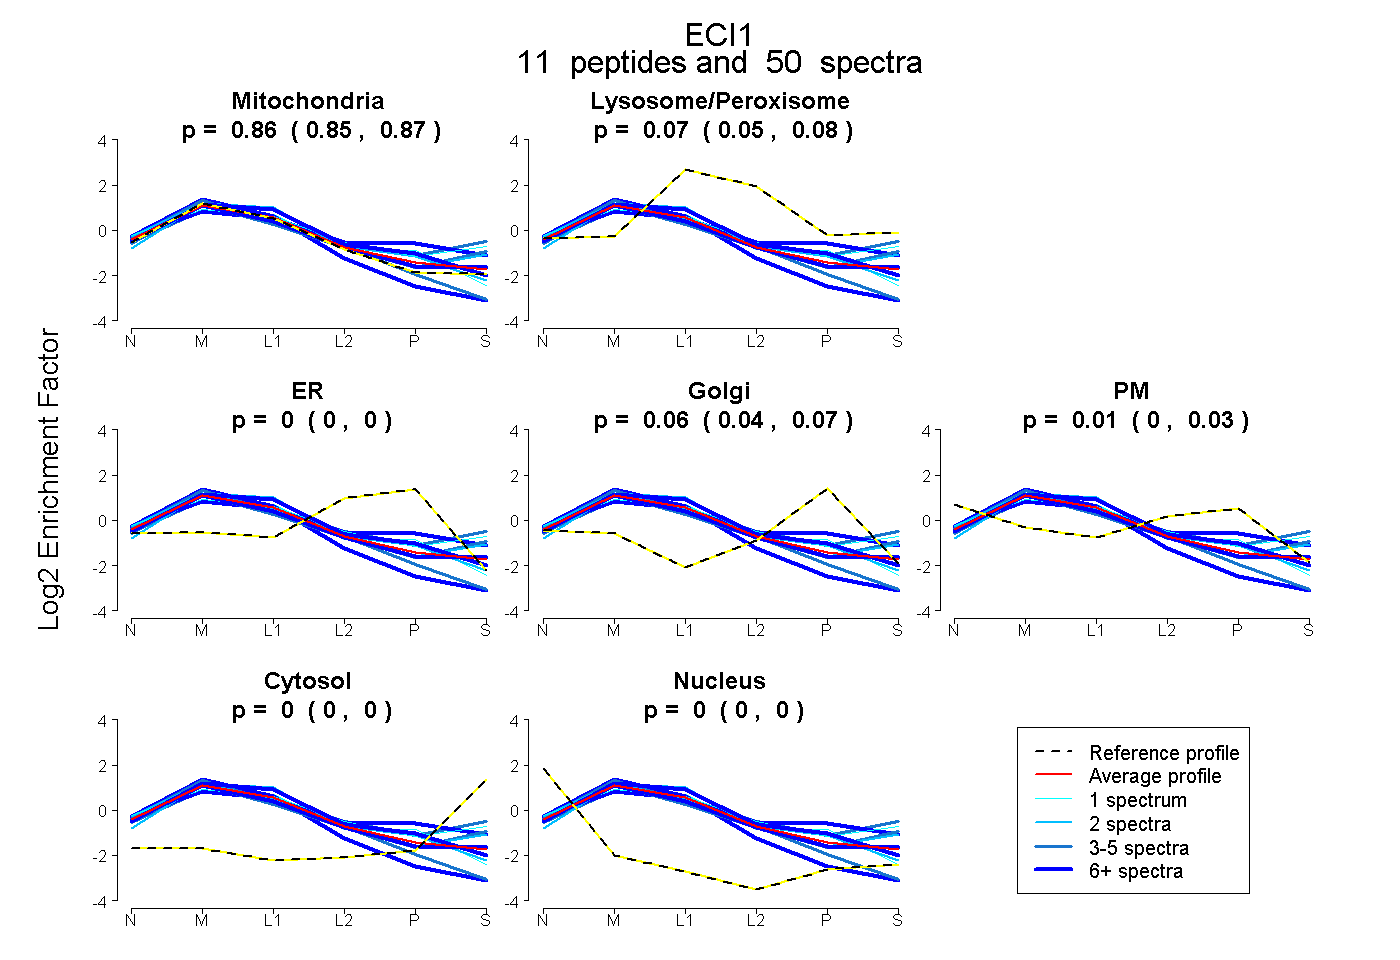 |
0.861 0.849 | 0.872 |
0.066 0.053 | 0.075 |
0.000 0.000 | 0.000 |
0.062 0.044 | 0.072 |
0.011 0.000 | 0.030 |
0.000 0.000 | 0.000 |
0.000 0.000 | 0.000 |
|||
| Plot | Lyso | Other | |||||||||||
| Expt C |
12 peptides |
461 spectra |
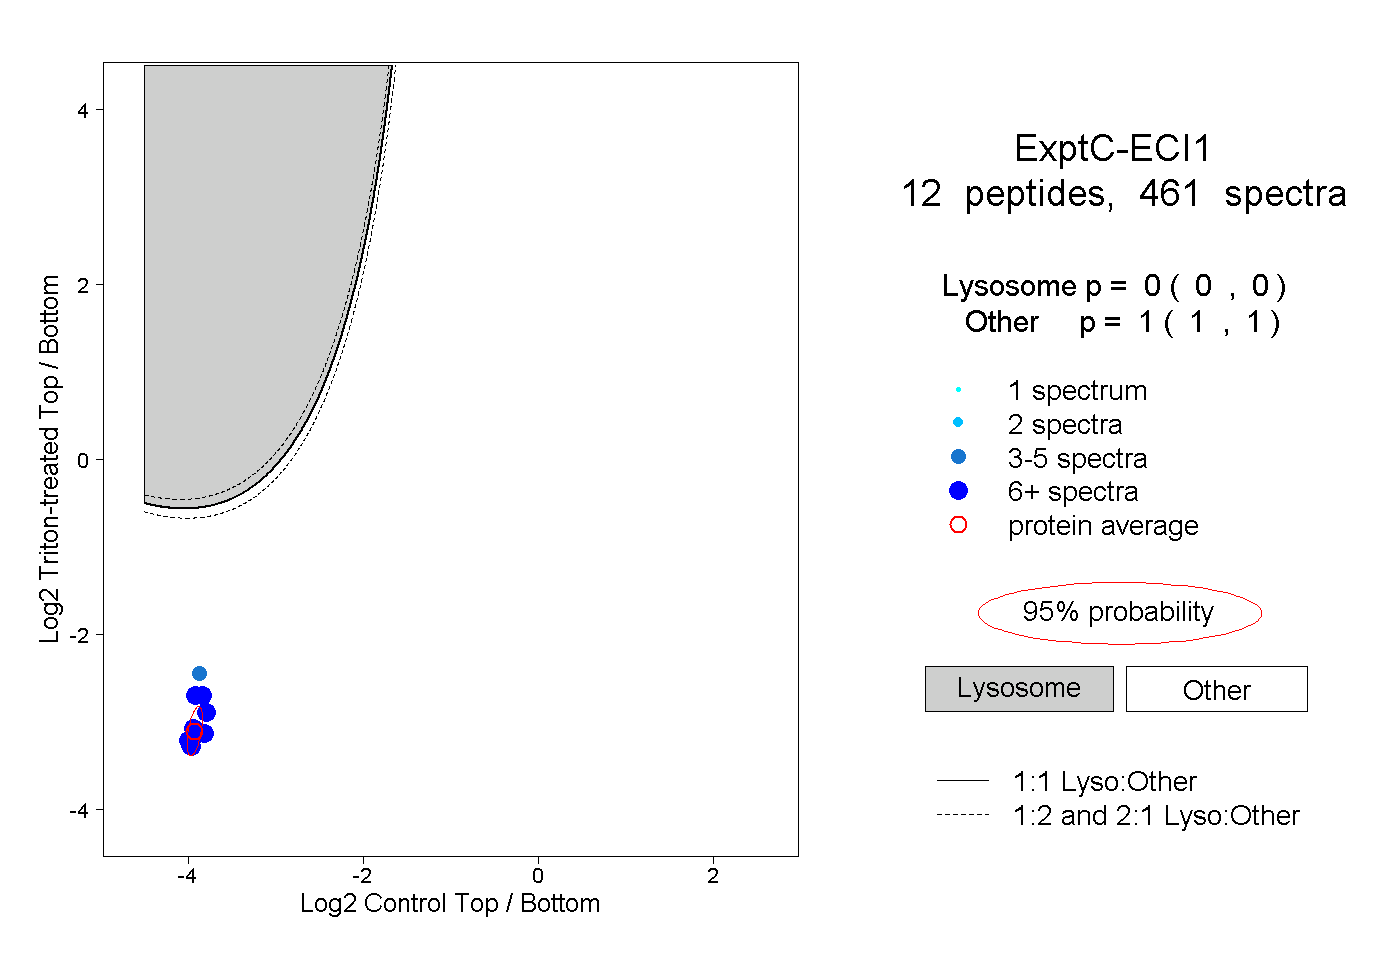 |
0.000 0.000 | 0.000 |
1.000 1.000 | 1.000 |
||||||||
| Plot | Lyso | Other | |||||||||||
| Expt D |
8 peptides |
26 spectra |
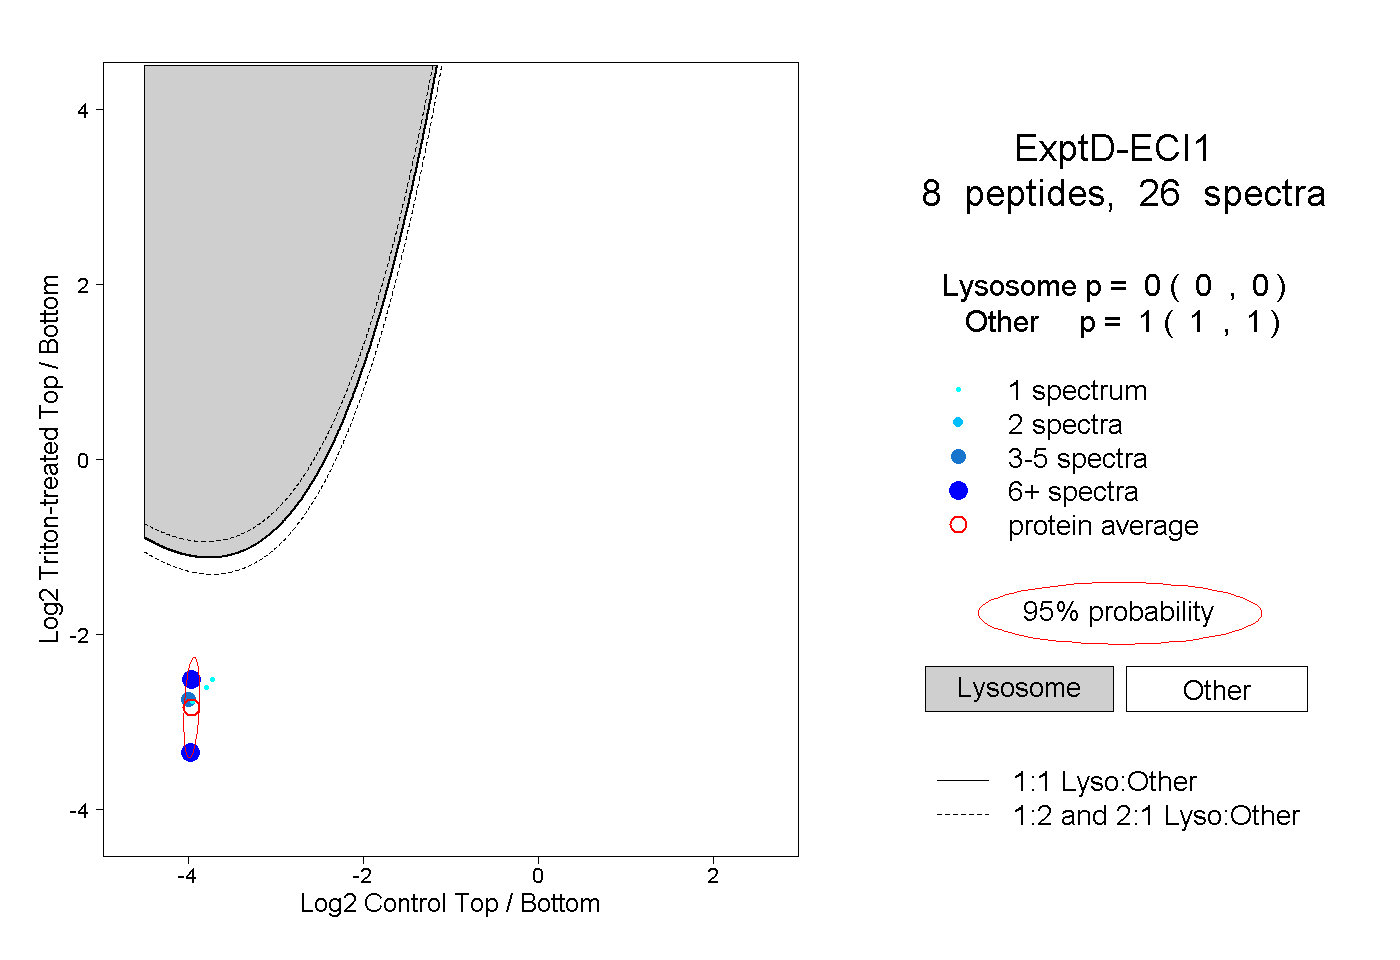 |
0.000 0.000 | 0.000 |
1.000 1.000 | 1.000 |