 1
1peptide
spectrum
NA | NA
NA | NA
NA | NA
NA | NA
NA | NA
NA | NA
NA | NA
NA | NA
1peptide
spectrum

NA | NA
NA | NA
NA | NA
NA | NA
NA | NA
NA | NA
NA | NA
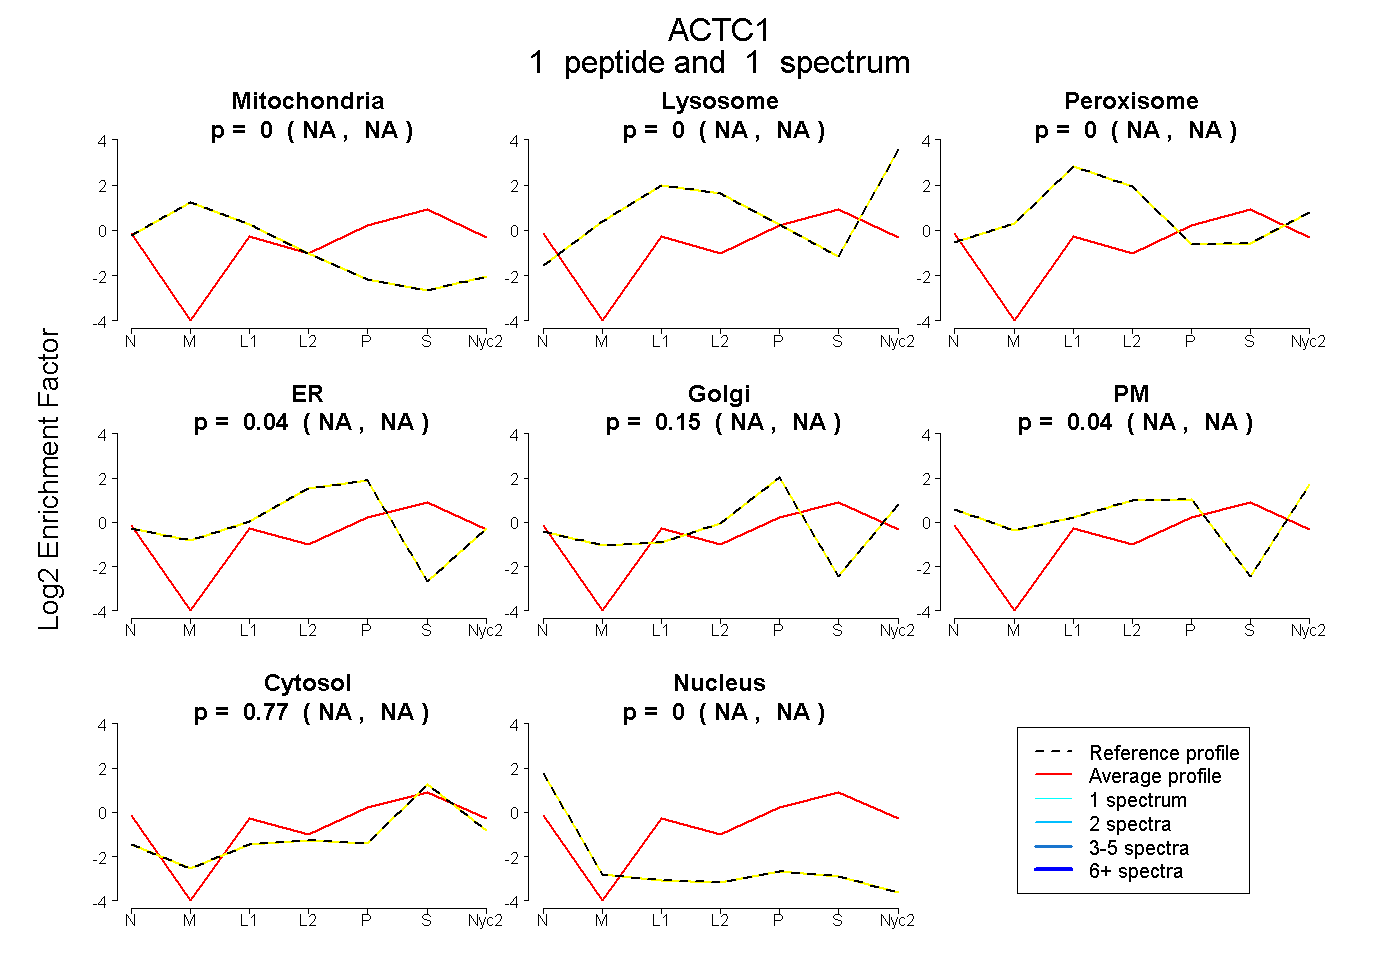
| Plot | Mito | Lyso | Perox | ER | Golgi | PM | Cytosol | Nucleus | |||||
| Expt A |
1 peptide |
1 spectrum |
|
0.000 NA | NA |
0.000 NA | NA |
0.000 NA | NA |
0.042 NA | NA |
0.152 NA | NA |
0.036 NA | NA |
0.770 NA | NA |
0.000 NA | NA |
||
| Plot | Mito | Lyso or Perox | ER | Golgi | PM | Cytosol | Nucleus | ||||||
| Expt B |
1 peptide |
1 spectrum |
|
0.088 NA | NA |
0.270 NA | NA |
0.000 NA | NA |
0.000 NA | NA |
0.210 NA | NA |
0.432 NA | NA |
0.000 NA | NA |
| 1 spectrum, DLYANNVLSGGTTMYPGIADR | 0.088 | 0.270 | 0.000 | 0.000 | 0.210 | 0.432 | 0.000 |