 1
1peptide
spectra
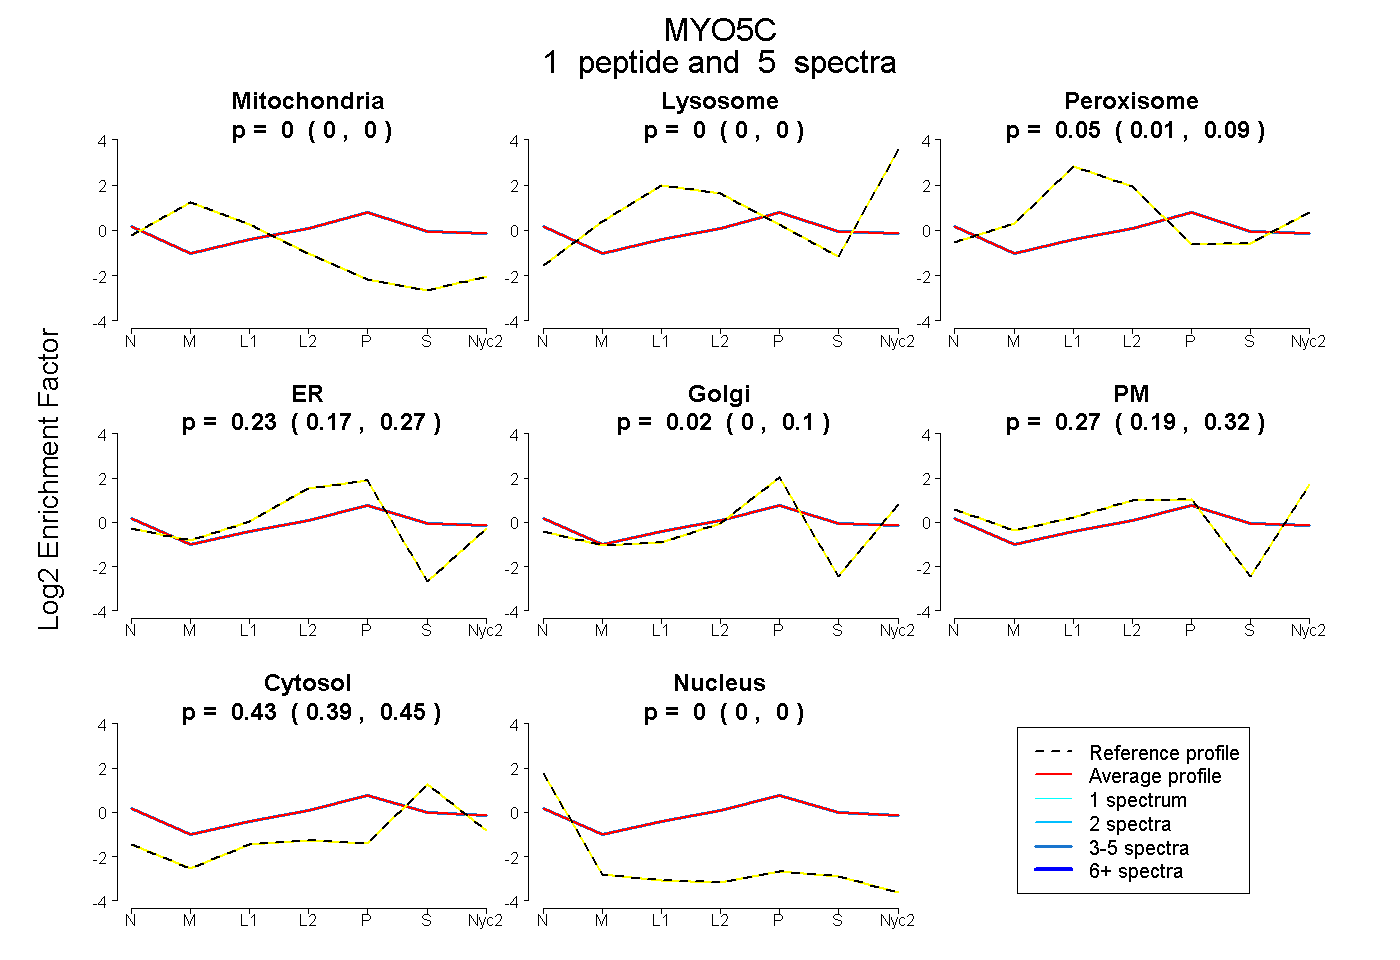
0.000 | 0.000
0.000 | 0.000
0.014 | 0.092
0.165 | 0.272
0.000 | 0.104
0.190 | 0.319
0.390 | 0.446
0.000 | 0.000
1peptide
spectrum
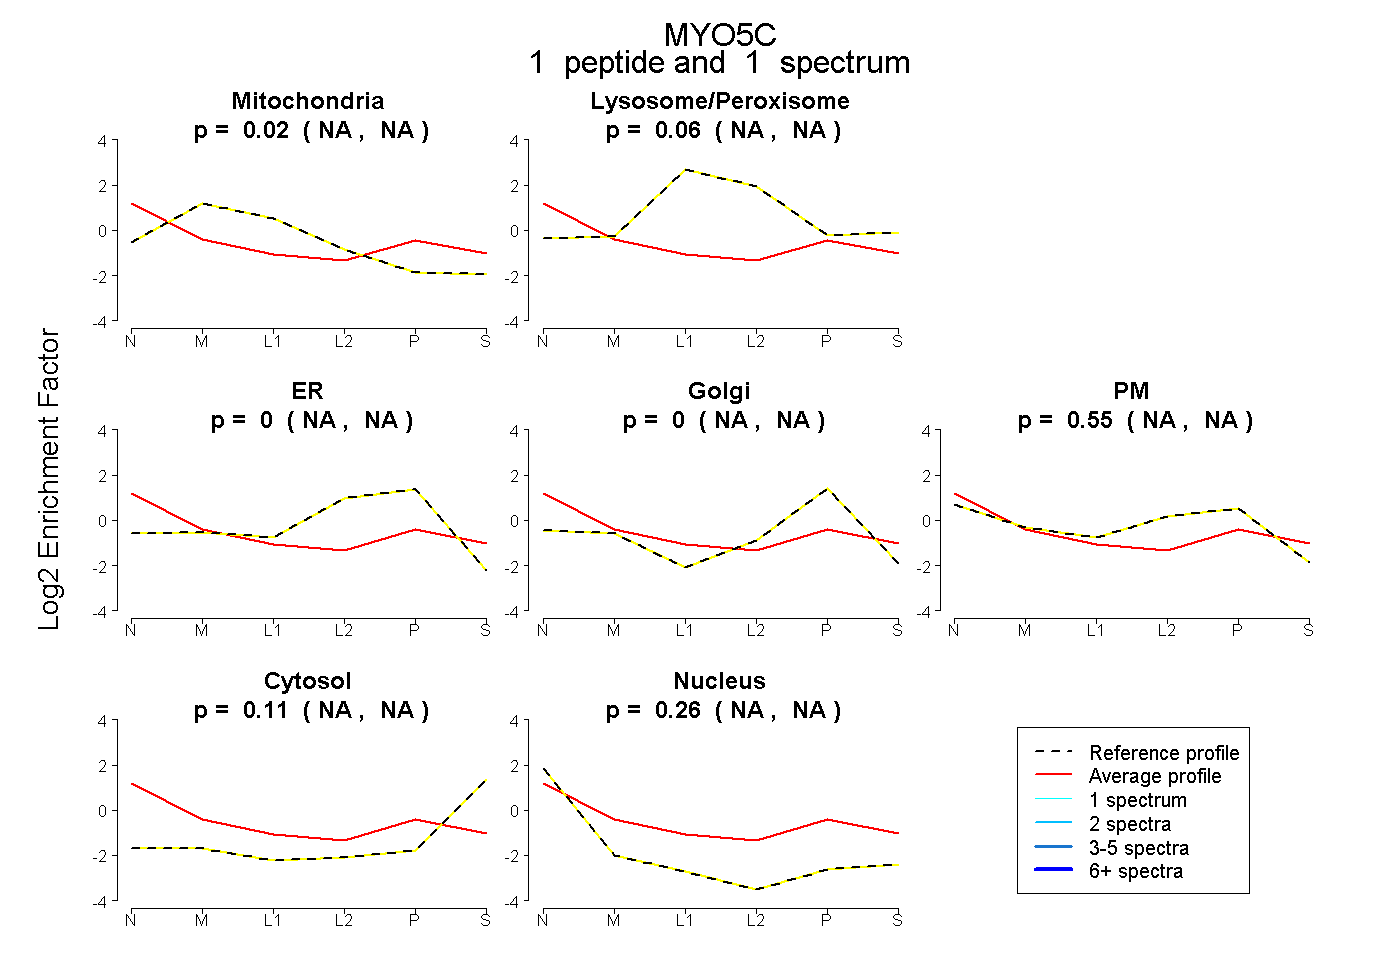
NA | NA
NA | NA
NA | NA
NA | NA
NA | NA
NA | NA
NA | NA
1peptide
spectrum
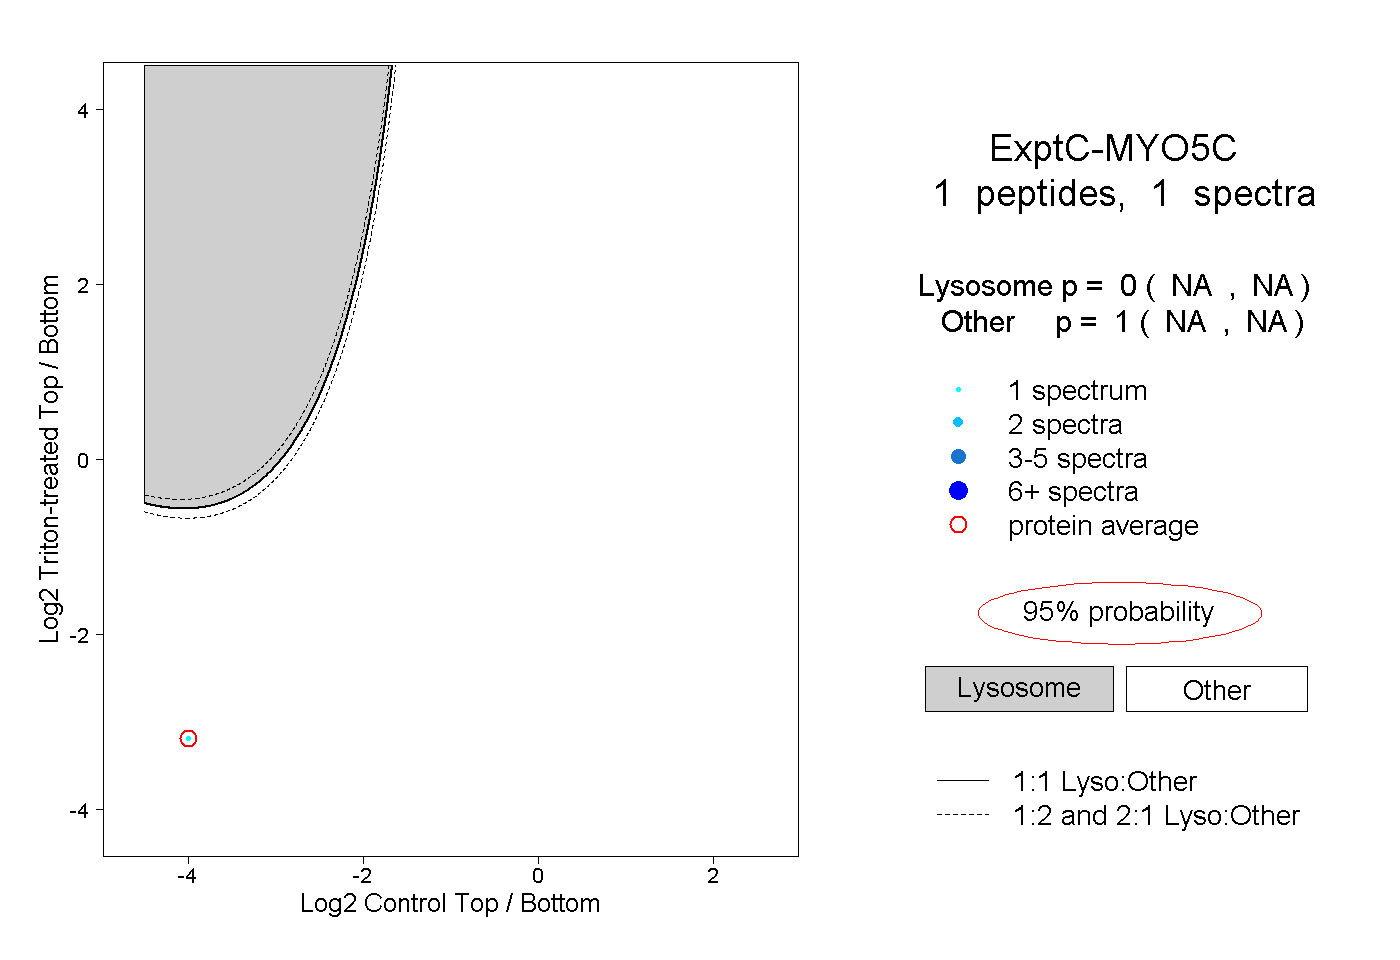
NA | NA
NA | NA
1peptide
spectrum
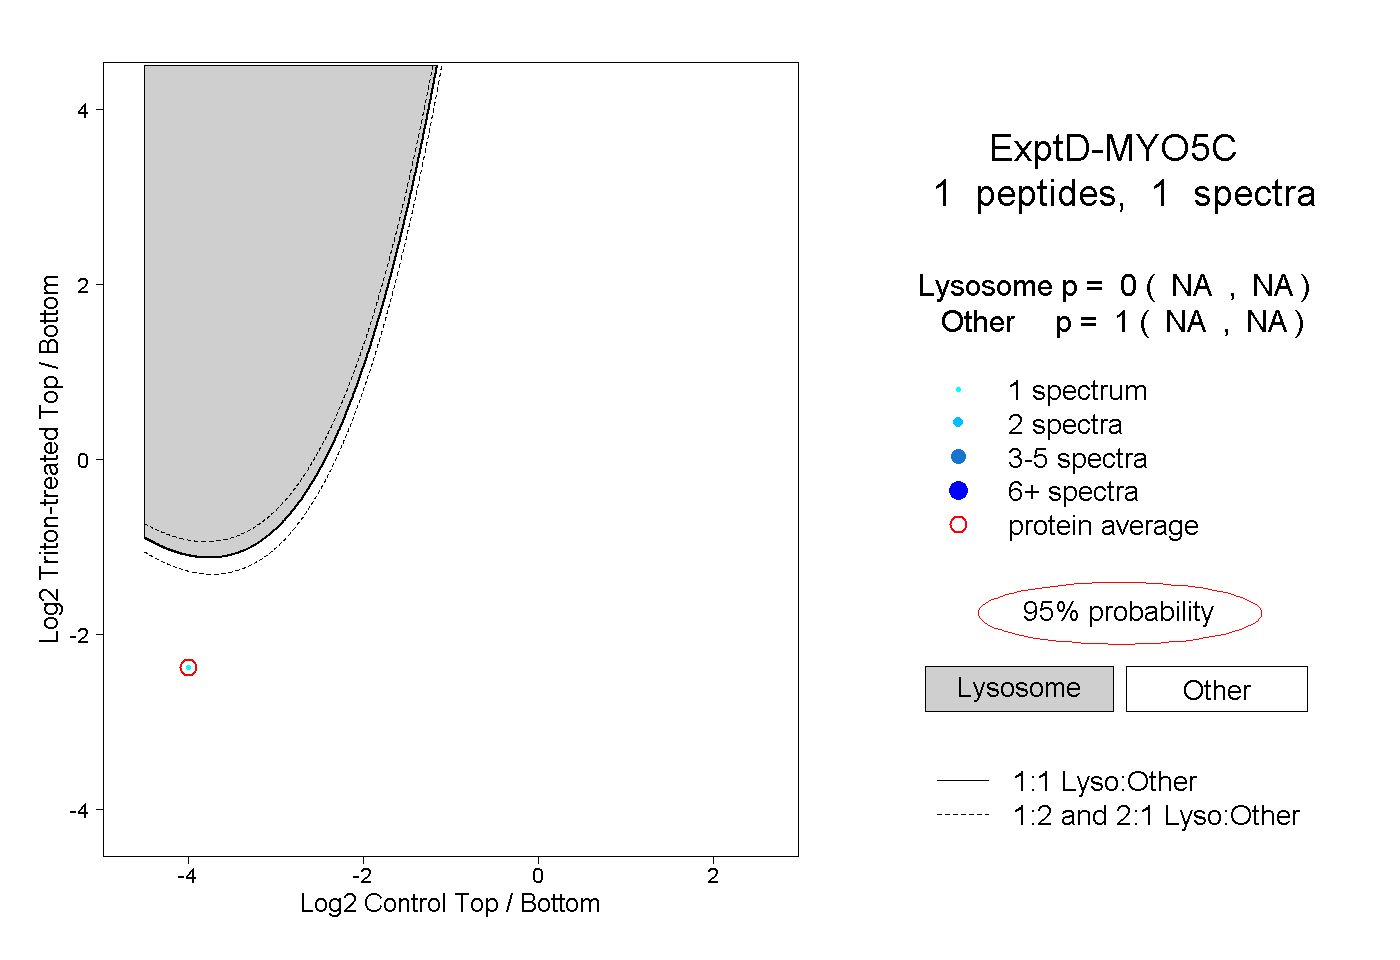
NA | NA
NA | NA