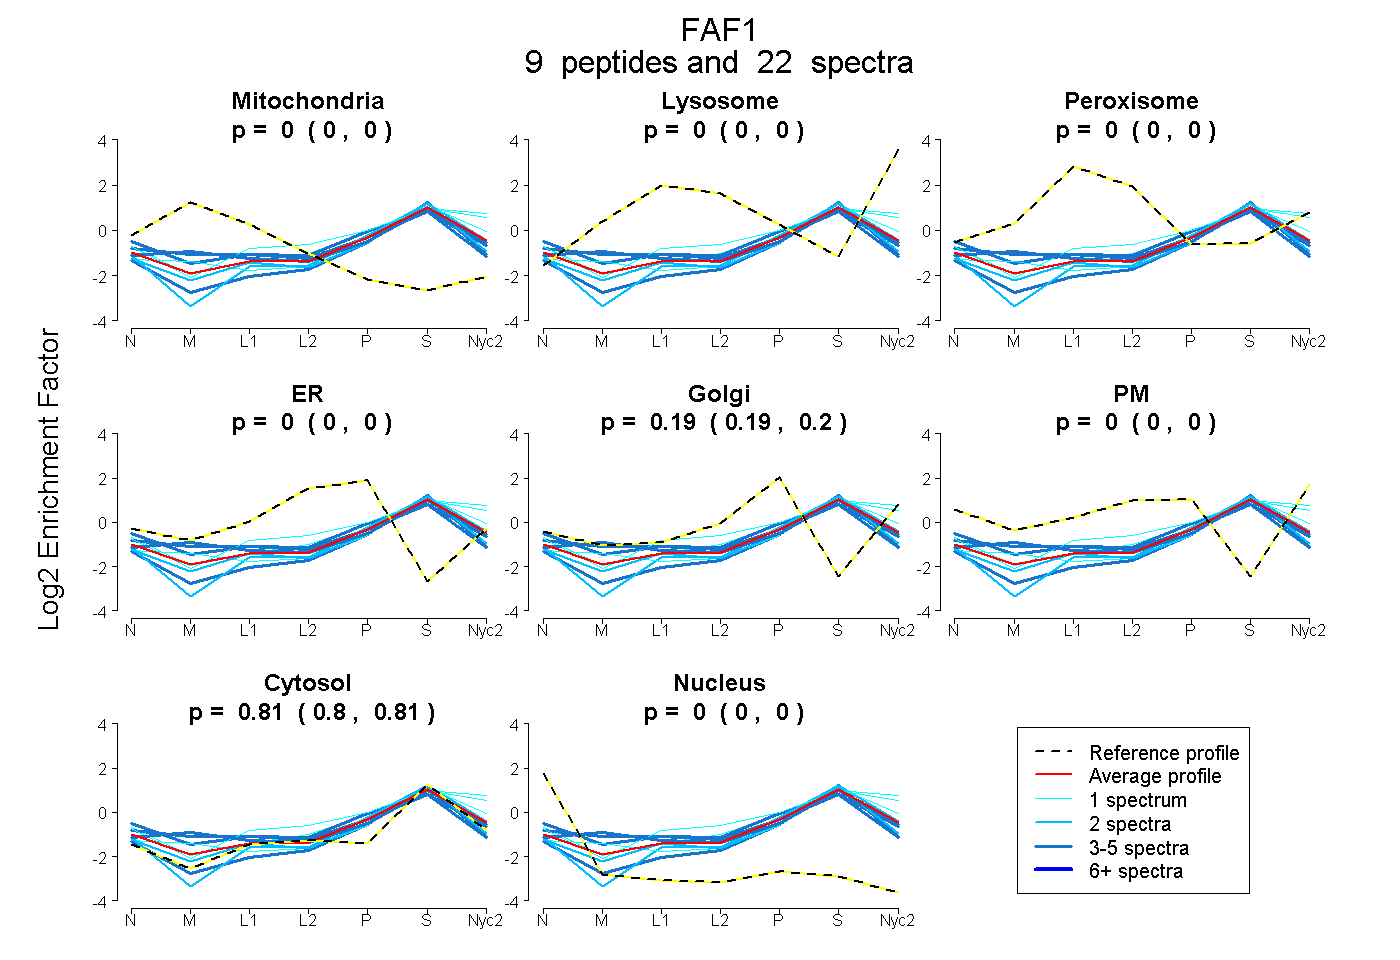
 9
9peptides
spectra
0.000 | 0.000
0.000 | 0.000
0.000 | 0.000
0.000 | 0.000
0.186 | 0.201
0.000 | 0.000
0.798 | 0.813
0.000 | 0.000
| Plot | Mito | Lyso | Perox | ER | Golgi | PM | Cytosol | Nucleus | |||||
| Expt A |
9 peptides |
22 spectra |
|
0.000 0.000 | 0.000 |
0.000 0.000 | 0.000 |
0.000 0.000 | 0.000 |
0.000 0.000 | 0.000 |
0.194 0.186 | 0.201 |
0.000 0.000 | 0.000 |
0.806 0.798 | 0.813 |
0.000 0.000 | 0.000 |
| 1 spectrum, TDQFPLFLIIMGK | 0.000 | 0.030 | 0.000 | 0.000 | 0.148 | 0.000 | 0.822 | 0.000 | ||
| 4 spectra, HFGSVIAQTIR | 0.060 | 0.000 | 0.006 | 0.000 | 0.144 | 0.070 | 0.721 | 0.000 | ||
| 1 spectrum, LTVGR | 0.000 | 0.144 | 0.000 | 0.000 | 0.120 | 0.059 | 0.677 | 0.000 | ||
| 1 spectrum, FLASNK | 0.000 | 0.105 | 0.000 | 0.000 | 0.190 | 0.010 | 0.695 | 0.000 | ||
| 2 spectra, TPSGEFLER | 0.000 | 0.000 | 0.000 | 0.000 | 0.100 | 0.000 | 0.898 | 0.003 | ||
| 4 spectra, FLTMCNR | 0.106 | 0.000 | 0.000 | 0.081 | 0.125 | 0.000 | 0.688 | 0.000 | ||
| 4 spectra, GFPWDEFK | 0.000 | 0.000 | 0.000 | 0.000 | 0.036 | 0.000 | 0.924 | 0.040 | ||
| 3 spectra, TSPVQTR | 0.104 | 0.044 | 0.000 | 0.000 | 0.122 | 0.000 | 0.729 | 0.000 | ||
| 2 spectra, LSLEADR | 0.000 | 0.000 | 0.000 | 0.000 | 0.105 | 0.000 | 0.895 | 0.000 |
| Plot | Mito | Lyso or Perox | ER | Golgi | PM | Cytosol | Nucleus | ||||||
| Expt B |
2 peptides |
2 spectra |
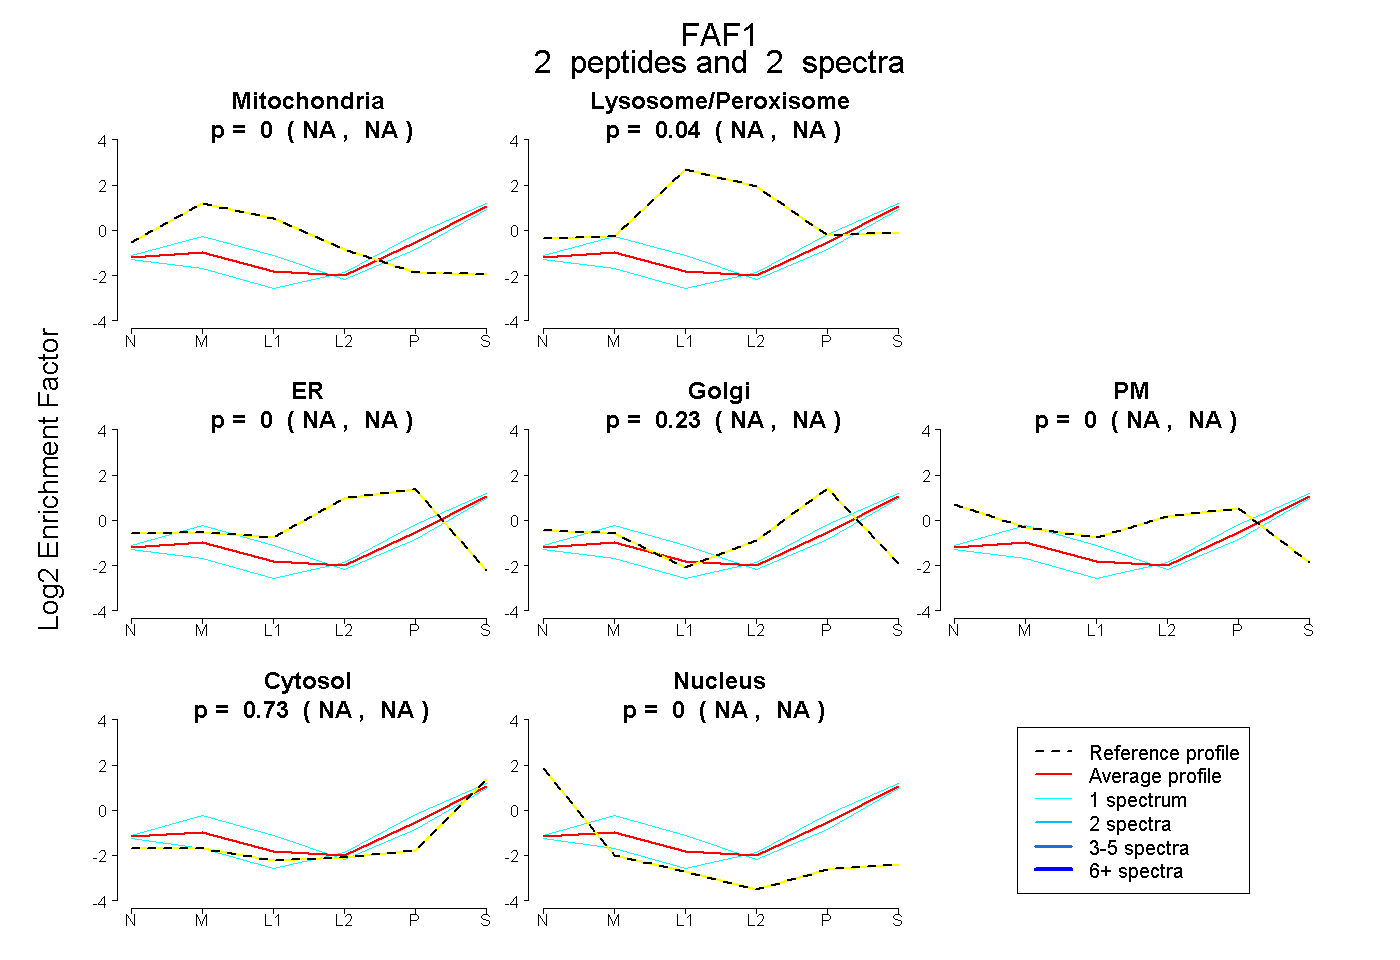 |
0.000 NA | NA |
0.042 NA | NA |
0.000 NA | NA |
0.229 NA | NA |
0.000 NA | NA |
0.729 NA | NA |
0.000 NA | NA |
|||
| Plot | Lyso | Other | |||||||||||
| Expt C |
6 peptides |
11 spectra |
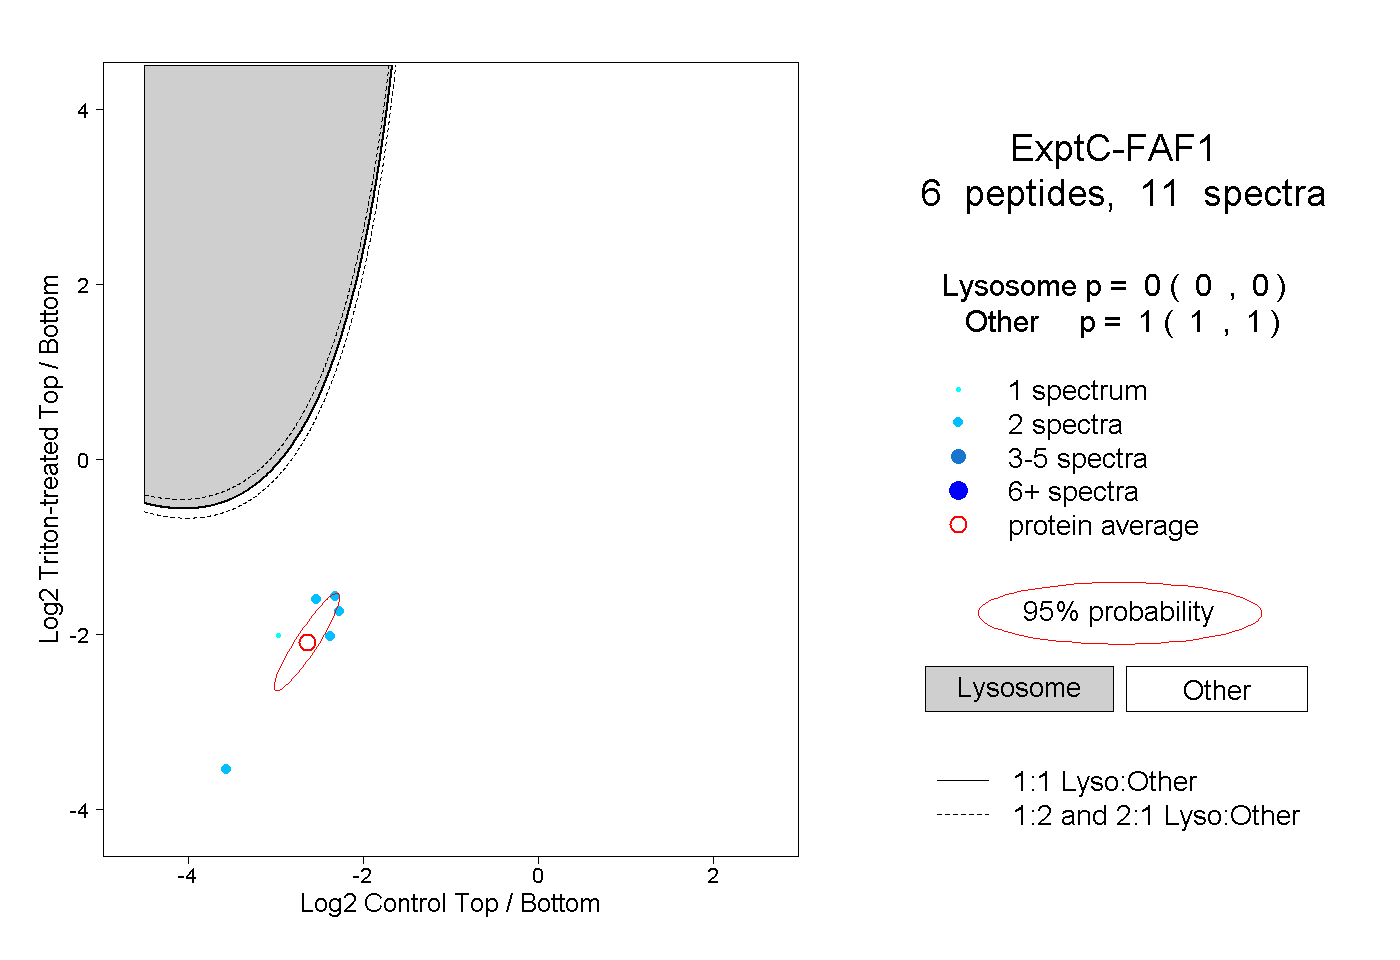 |
0.000 0.000 | 0.000 |
1.000 1.000 | 1.000 |