 3
3peptides
spectra
0.000 | 0.000
0.000 | 0.000
0.000 | 0.000
0.000 | 0.142
0.000 | 0.123
0.110 | 0.281
0.671 | 0.726
0.000 | 0.023
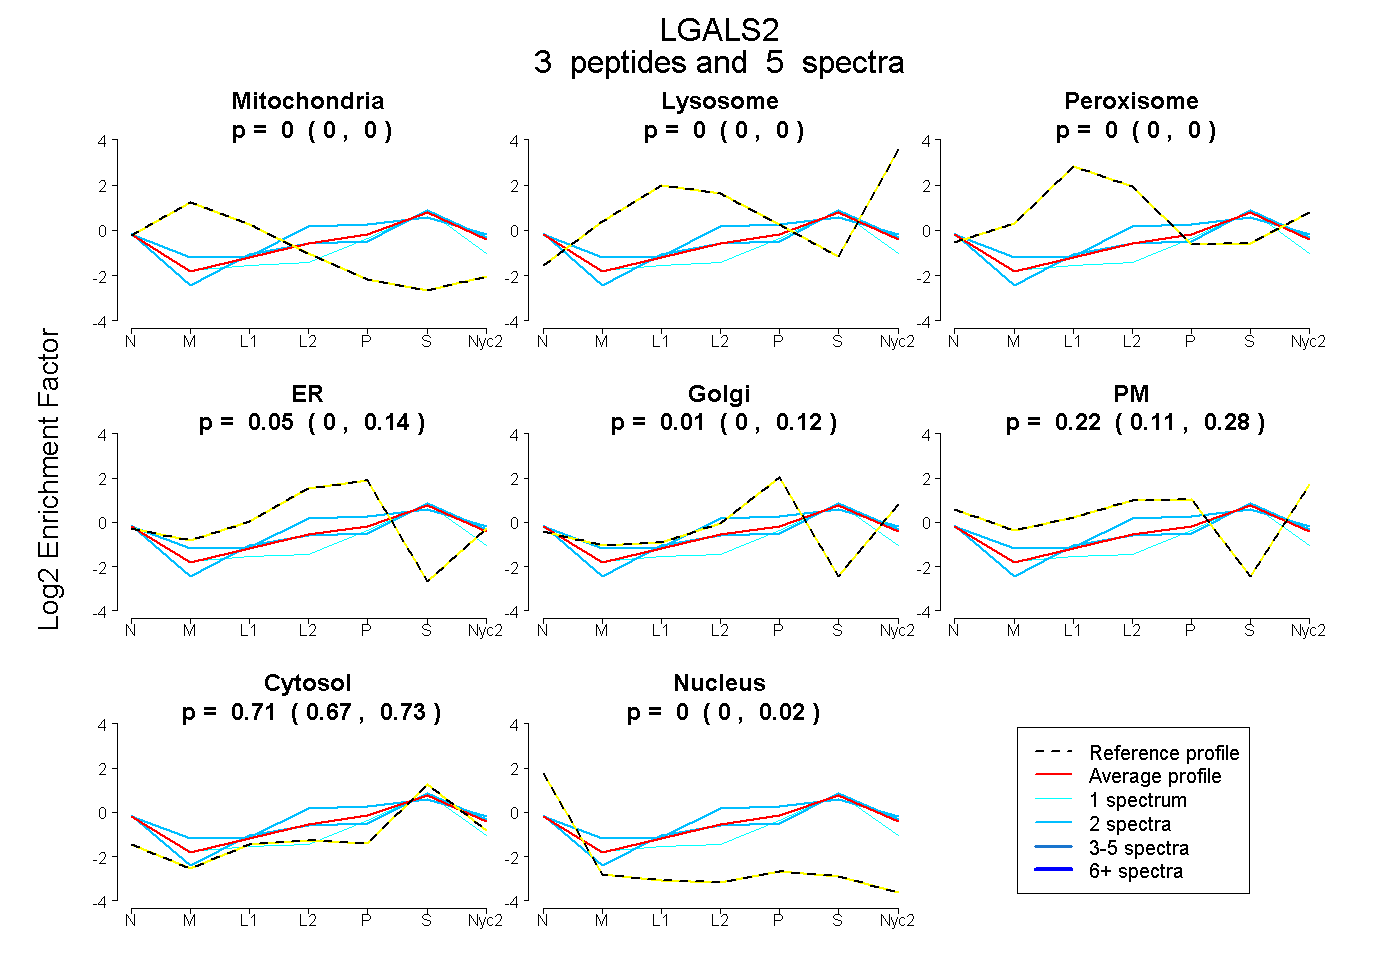
| Plot | Mito | Lyso | Perox | ER | Golgi | PM | Cytosol | Nucleus | |||||
| Expt A |
3 peptides |
5 spectra |
|
0.000 0.000 | 0.000 |
0.000 0.000 | 0.000 |
0.000 0.000 | 0.000 |
0.054 0.000 | 0.142 |
0.011 0.000 | 0.123 |
0.223 0.110 | 0.281 |
0.711 0.671 | 0.726 |
0.000 0.000 | 0.023 |
| 1 spectrum, ETLNLHFNPR | 0.000 | 0.000 | 0.000 | 0.000 | 0.176 | 0.009 | 0.722 | 0.092 | ||
| 2 spectra, VTLPDGHSLTFPNR | 0.000 | 0.000 | 0.000 | 0.000 | 0.000 | 0.233 | 0.762 | 0.004 | ||
| 2 spectra, LGHNHLR | 0.000 | 0.000 | 0.013 | 0.168 | 0.000 | 0.244 | 0.574 | 0.000 |