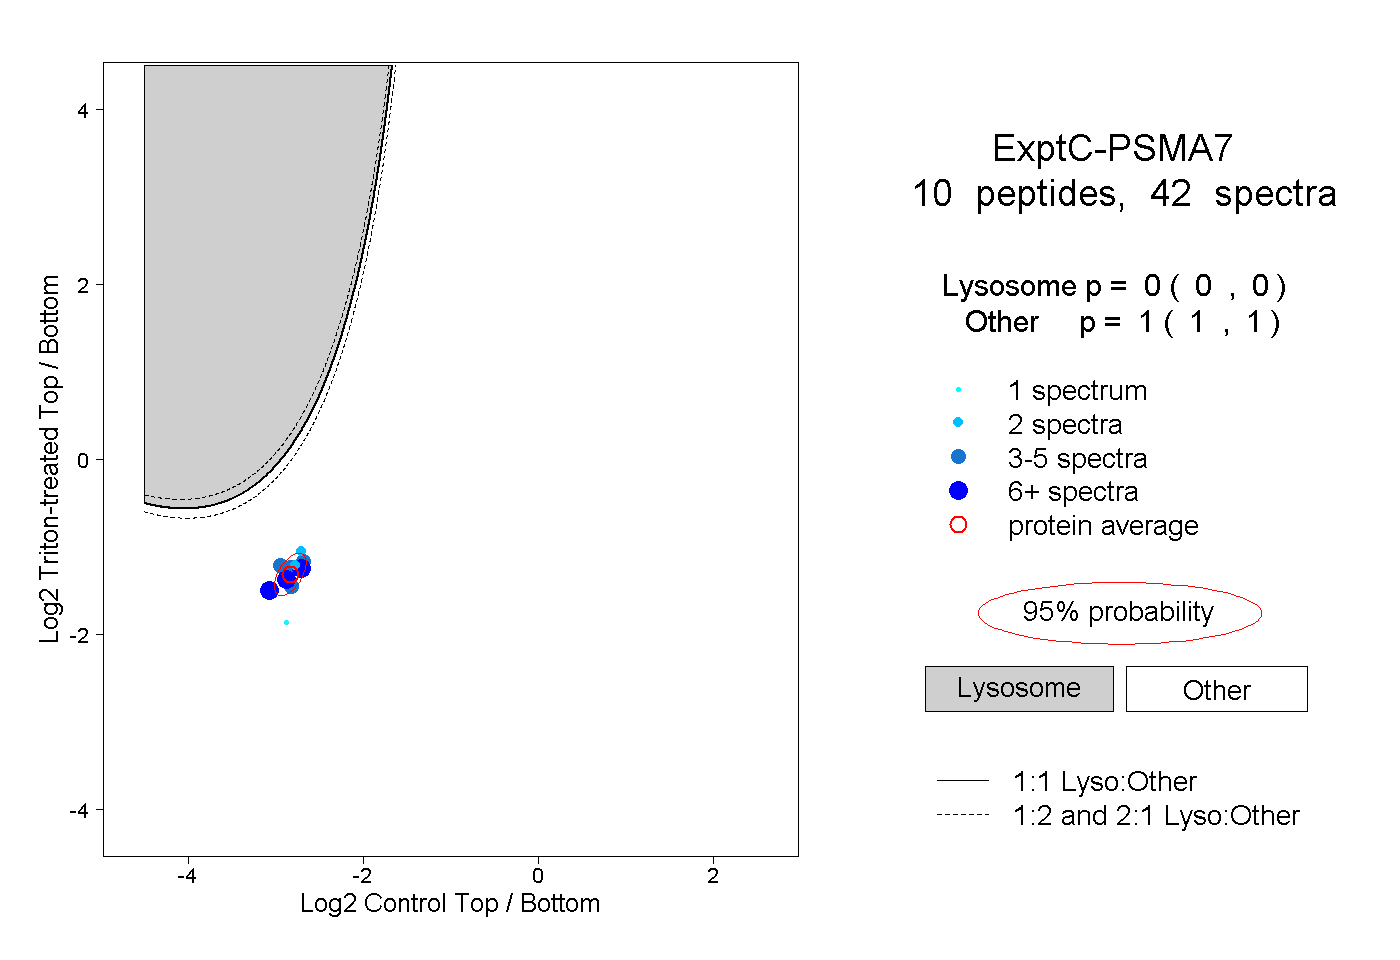
10
10peptides
spectra
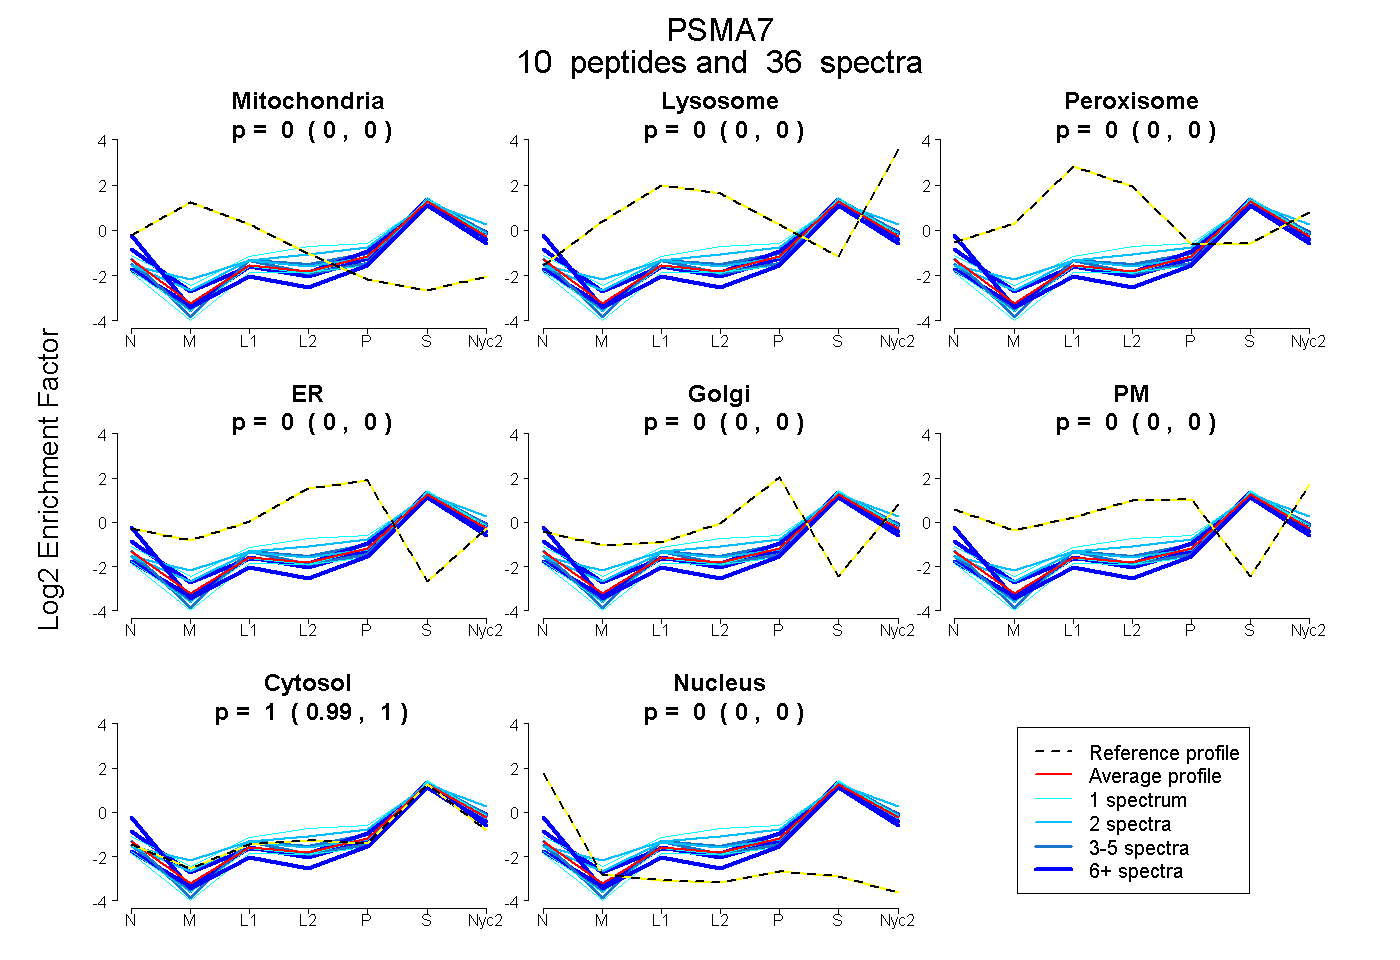
0.000 | 0.000
0.000 | 0.000
0.000 | 0.000
0.000 | 0.000
0.000 | 0.004
0.000 | 0.000
0.994 | 1.000
0.000 | 0.002
5peptides
spectra
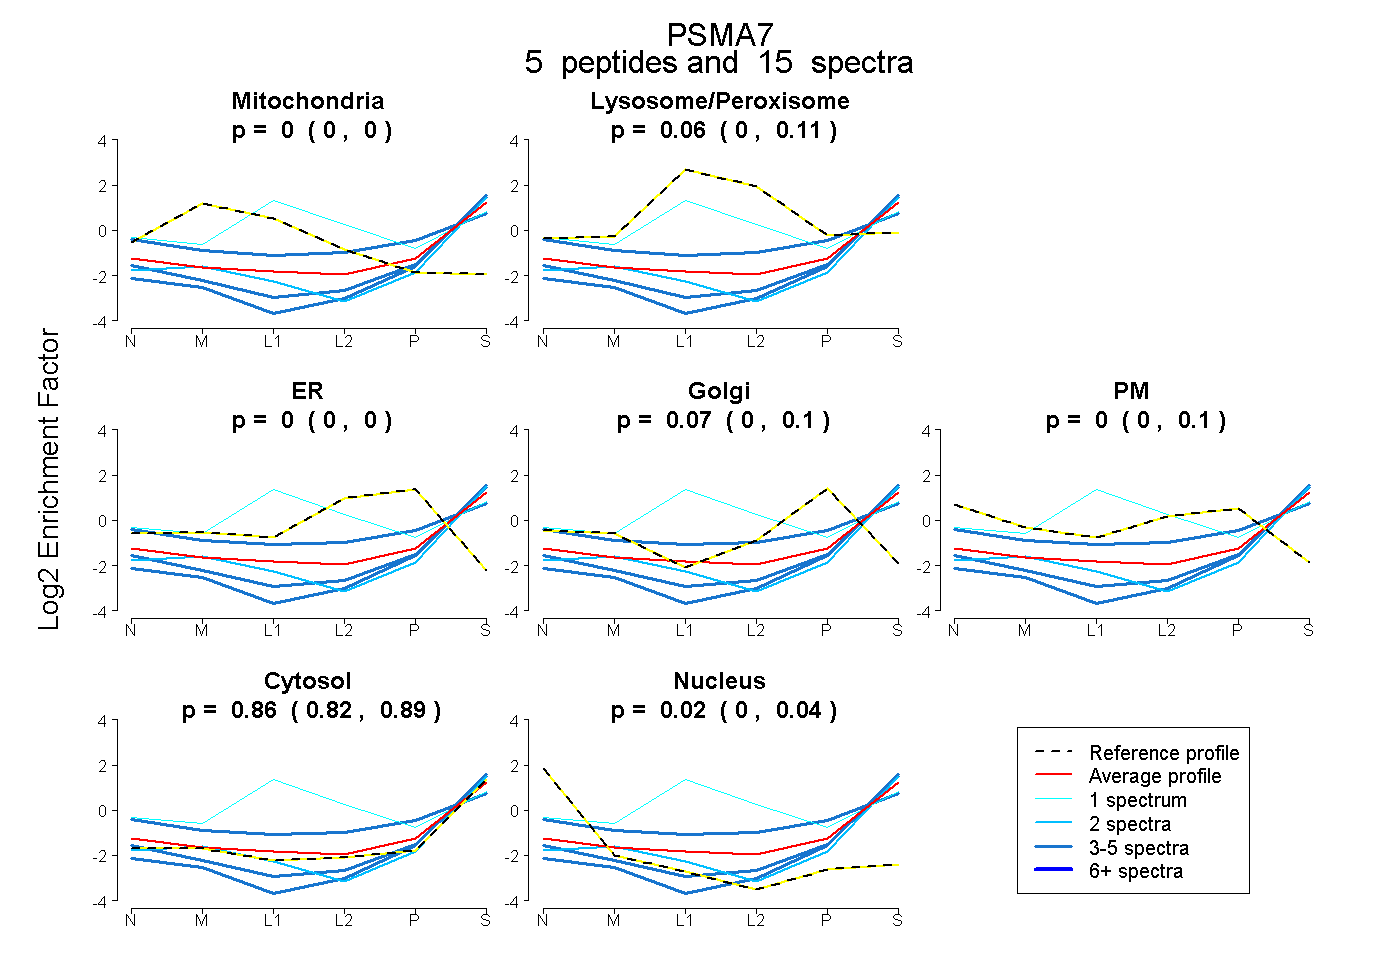
0.000 | 0.000
0.000 | 0.115
0.000 | 0.000
0.000 | 0.096
0.000 | 0.101
0.818 | 0.892
0.000 | 0.043