 10
10peptides
spectra
0.000 | 0.000
0.000 | 0.000
0.000 | 0.000
0.000 | 0.000
0.000 | 0.004
0.000 | 0.000
0.994 | 1.000
0.000 | 0.002
| Plot | Mito | Lyso | Perox | ER | Golgi | PM | Cytosol | Nucleus | |||||
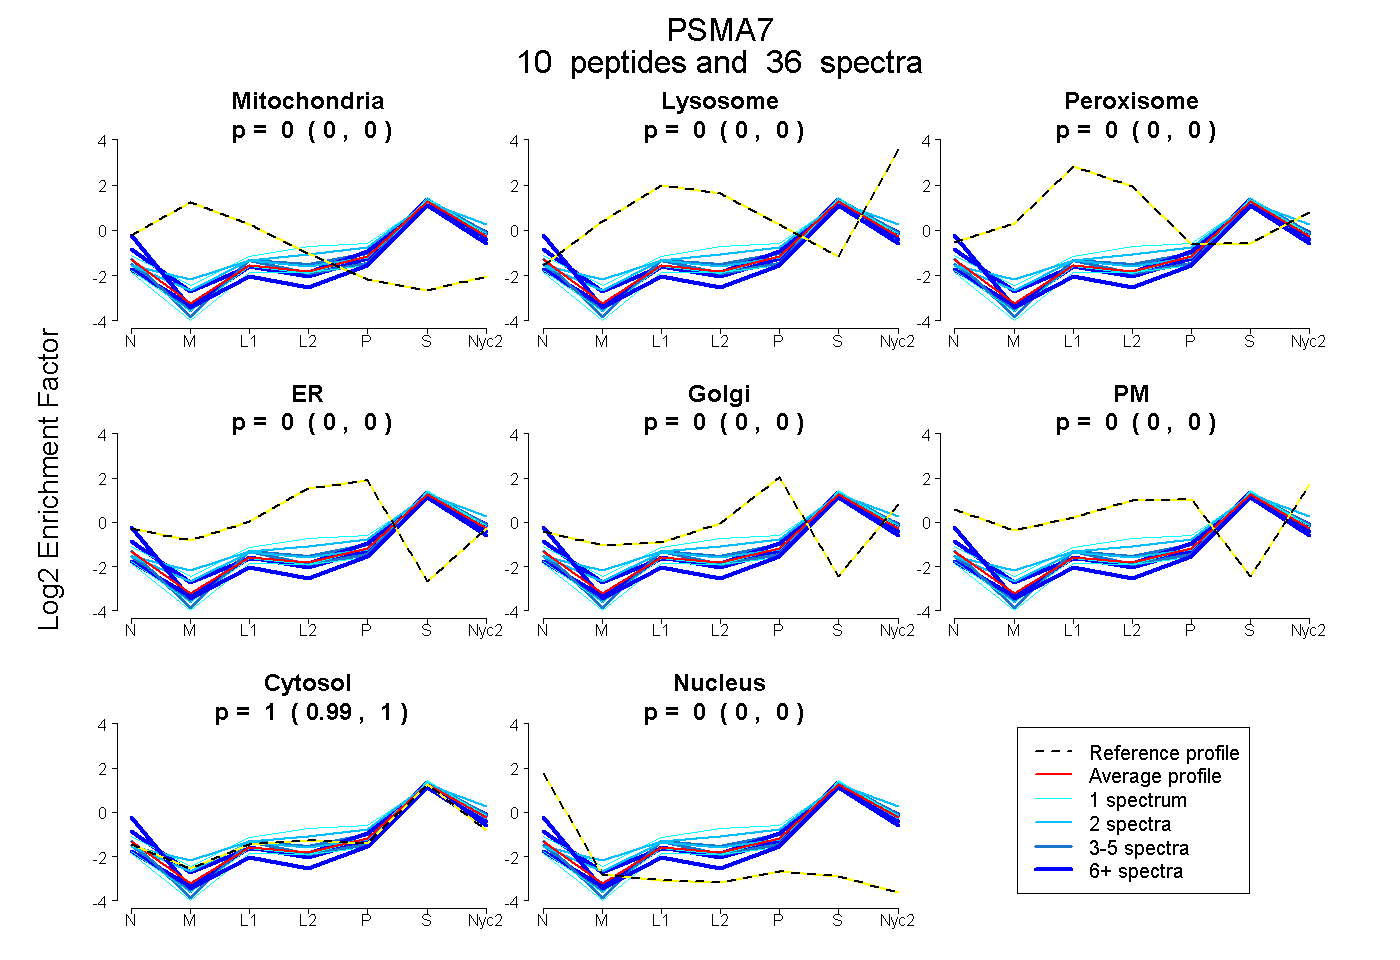
| Expt A |
10 peptides |
36 spectra |
|
0.000 0.000 | 0.000 |
0.000 0.000 | 0.000 |
0.000 0.000 | 0.000 |
0.000 0.000 | 0.000 |
0.000 0.000 | 0.004 |
0.000 0.000 | 0.000 |
1.000 0.994 | 1.000 |
0.000 0.000 | 0.002 |
| 2 spectra, LYQTDPSGTYHAWK | 0.000 | 0.029 | 0.000 | 0.000 | 0.000 | 0.000 | 0.971 | 0.000 | ||
| 8 spectra, GSTAVGVR | 0.000 | 0.000 | 0.000 | 0.000 | 0.000 | 0.000 | 1.000 | 0.000 | ||
| 8 spectra, YVAEIEK | 0.000 | 0.000 | 0.000 | 0.000 | 0.000 | 0.000 | 0.828 | 0.172 | ||
| 1 spectrum, YIASLK | 0.000 | 0.000 | 0.000 | 0.000 | 0.000 | 0.000 | 1.000 | 0.000 | ||
| 4 spectra, ALLEVVQSGGK | 0.000 | 0.000 | 0.000 | 0.000 | 0.007 | 0.000 | 0.993 | 0.000 | ||
| 2 spectra, YTQSNGR | 0.000 | 0.131 | 0.000 | 0.000 | 0.018 | 0.000 | 0.851 | 0.000 | ||
| 1 spectrum, NYTDDAIETDDLTIK | 0.000 | 0.000 | 0.000 | 0.000 | 0.000 | 0.000 | 1.000 | 0.000 | ||
| 6 spectra, ILSPEEIEK | 0.000 | 0.000 | 0.000 | 0.000 | 0.081 | 0.000 | 0.906 | 0.013 | ||
| 1 spectrum, VECQSHR | 0.000 | 0.036 | 0.000 | 0.091 | 0.019 | 0.000 | 0.855 | 0.000 | ||
| 3 spectra, LTVEDPVTVEYITR | 0.000 | 0.000 | 0.000 | 0.000 | 0.000 | 0.000 | 1.000 | 0.000 |
| Plot | Mito | Lyso or Perox | ER | Golgi | PM | Cytosol | Nucleus | ||||||
| Expt B |
5 peptides |
15 spectra |
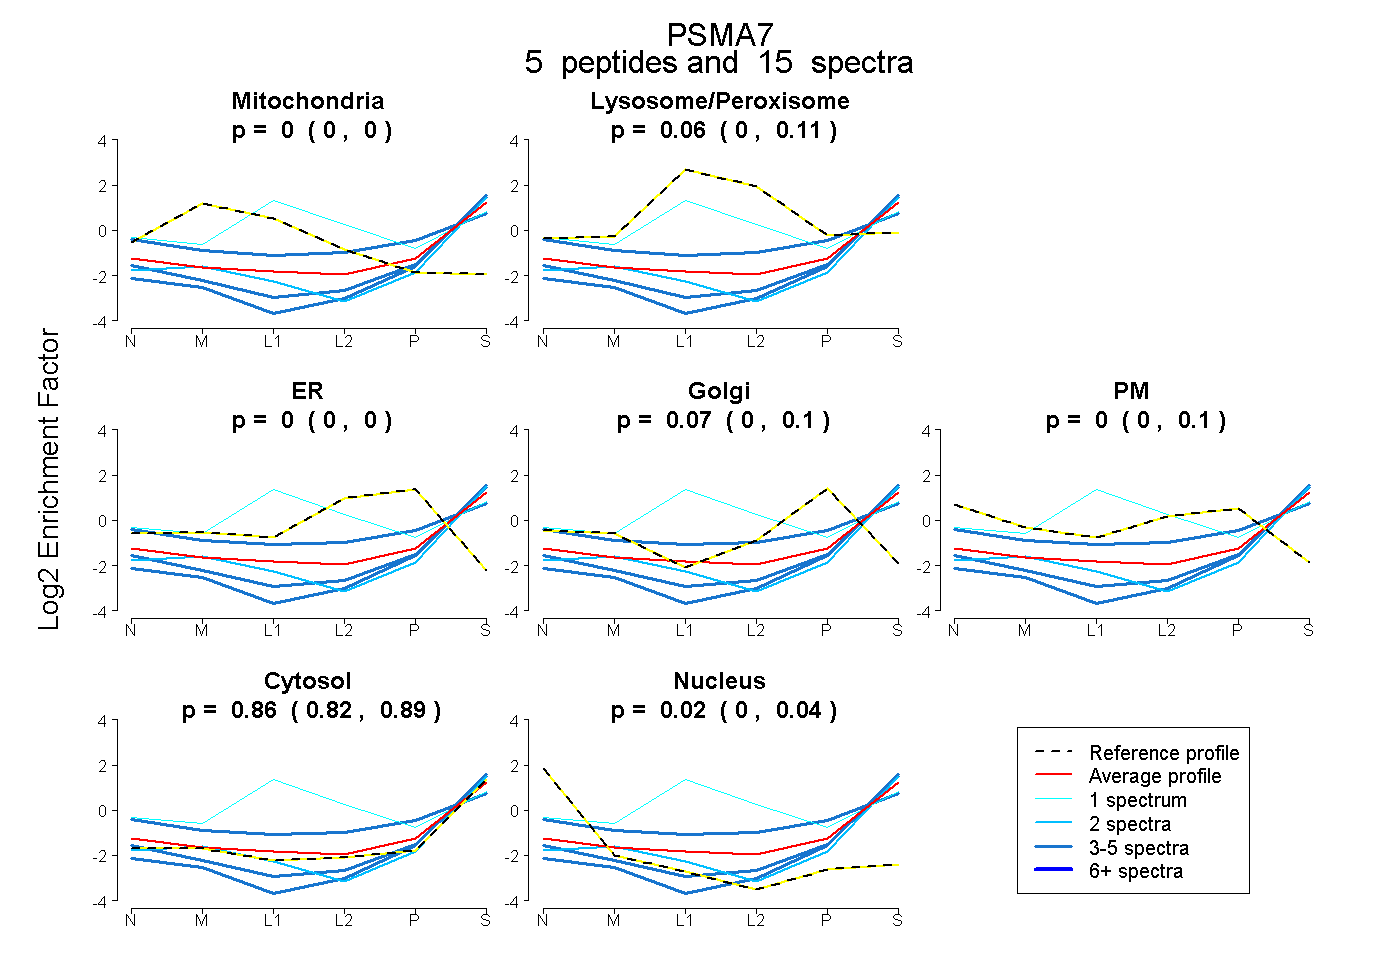 |
0.000 0.000 | 0.000 |
0.061 0.000 | 0.115 |
0.000 0.000 | 0.000 |
0.065 0.000 | 0.096 |
0.000 0.000 | 0.101 |
0.859 0.818 | 0.892 |
0.015 0.000 | 0.043 |
|||
| Plot | Lyso | Other | |||||||||||
| Expt C |
10 peptides |
42 spectra |
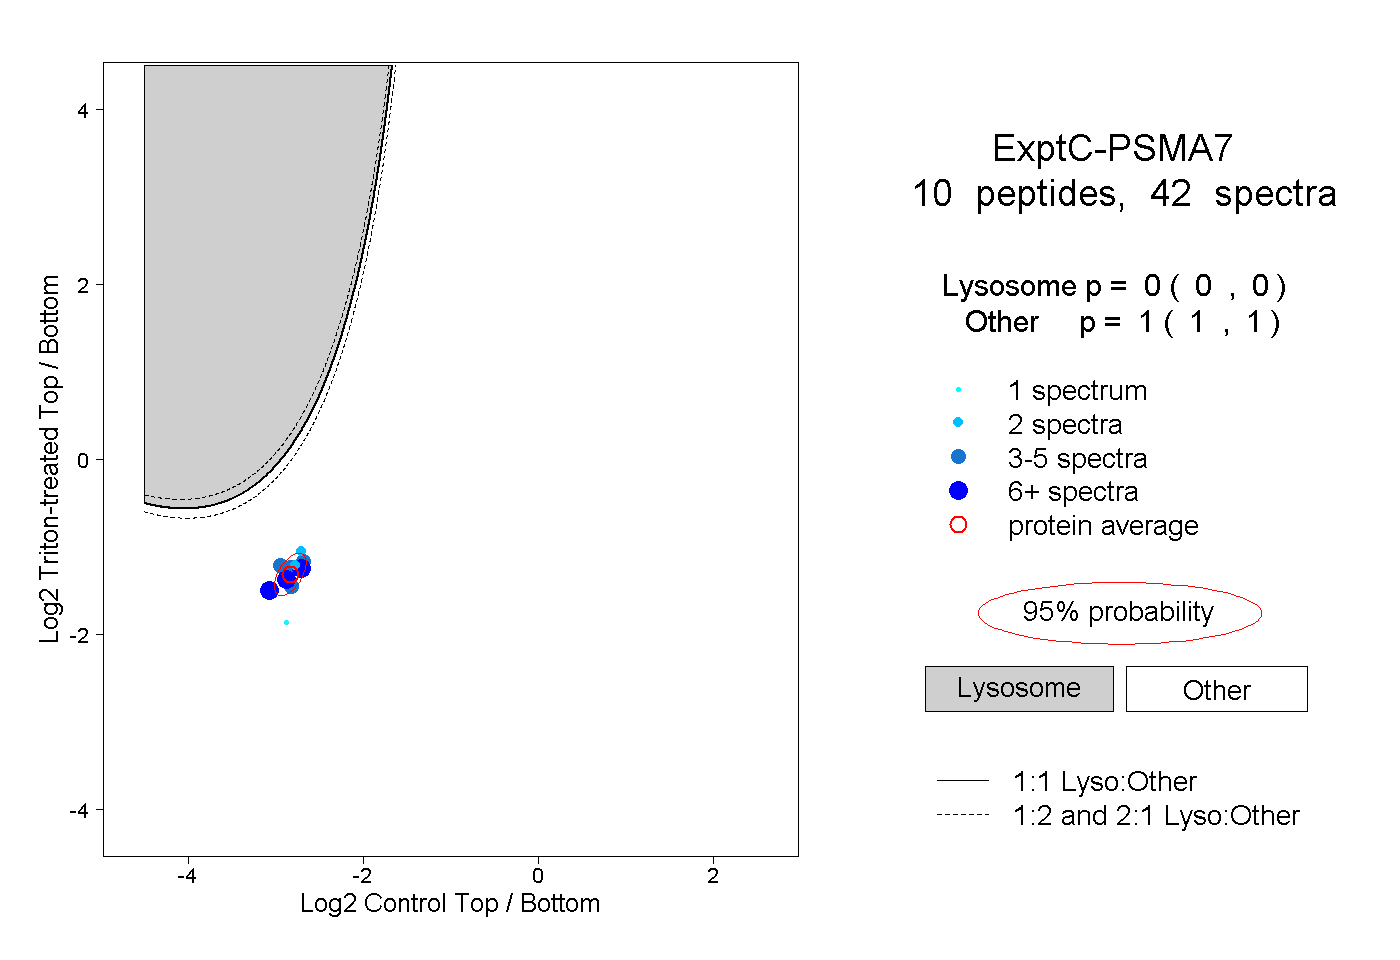 |
0.000 0.000 | 0.000 |
1.000 1.000 | 1.000 |
||||||||
| Plot | Lyso | Other | |||||||||||
| Expt D |
1 peptide |
1 spectrum |
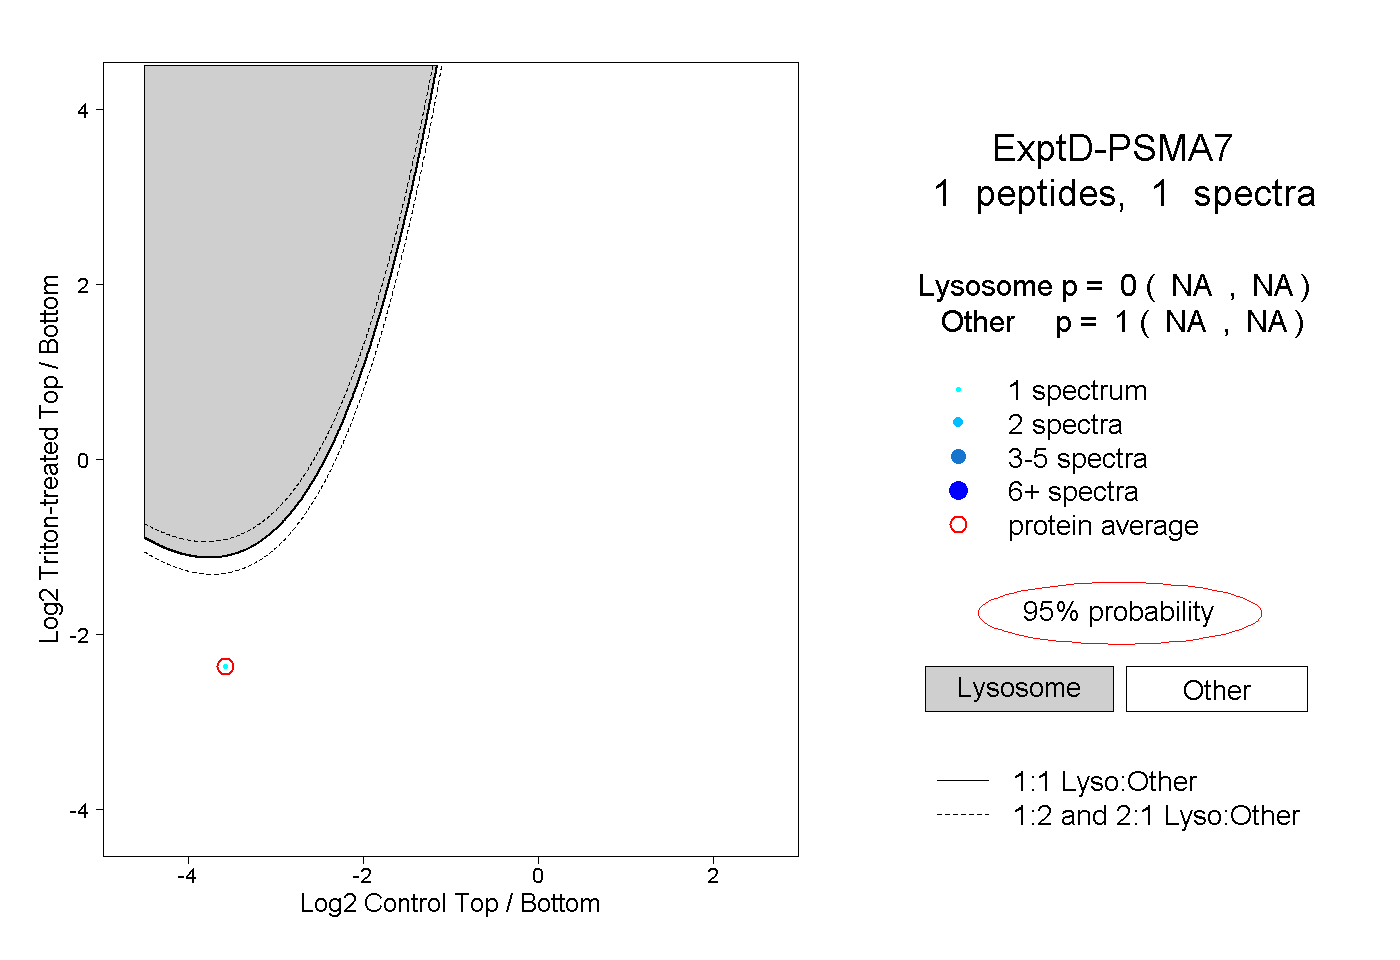 |
0.000 NA | NA |
1.000 NA | NA |