 2
2peptides
spectra
0.000 | 0.127
0.000 | 0.365
0.000 | 0.070
0.000 | 0.000
0.000 | 0.000
0.524 | 0.901
0.000 | 0.000
0.000 | 0.040
1peptide
spectrum
NA | NA
NA | NA
| Plot | Mito | Lyso | Perox | ER | Golgi | PM | Cytosol | Nucleus | |||||
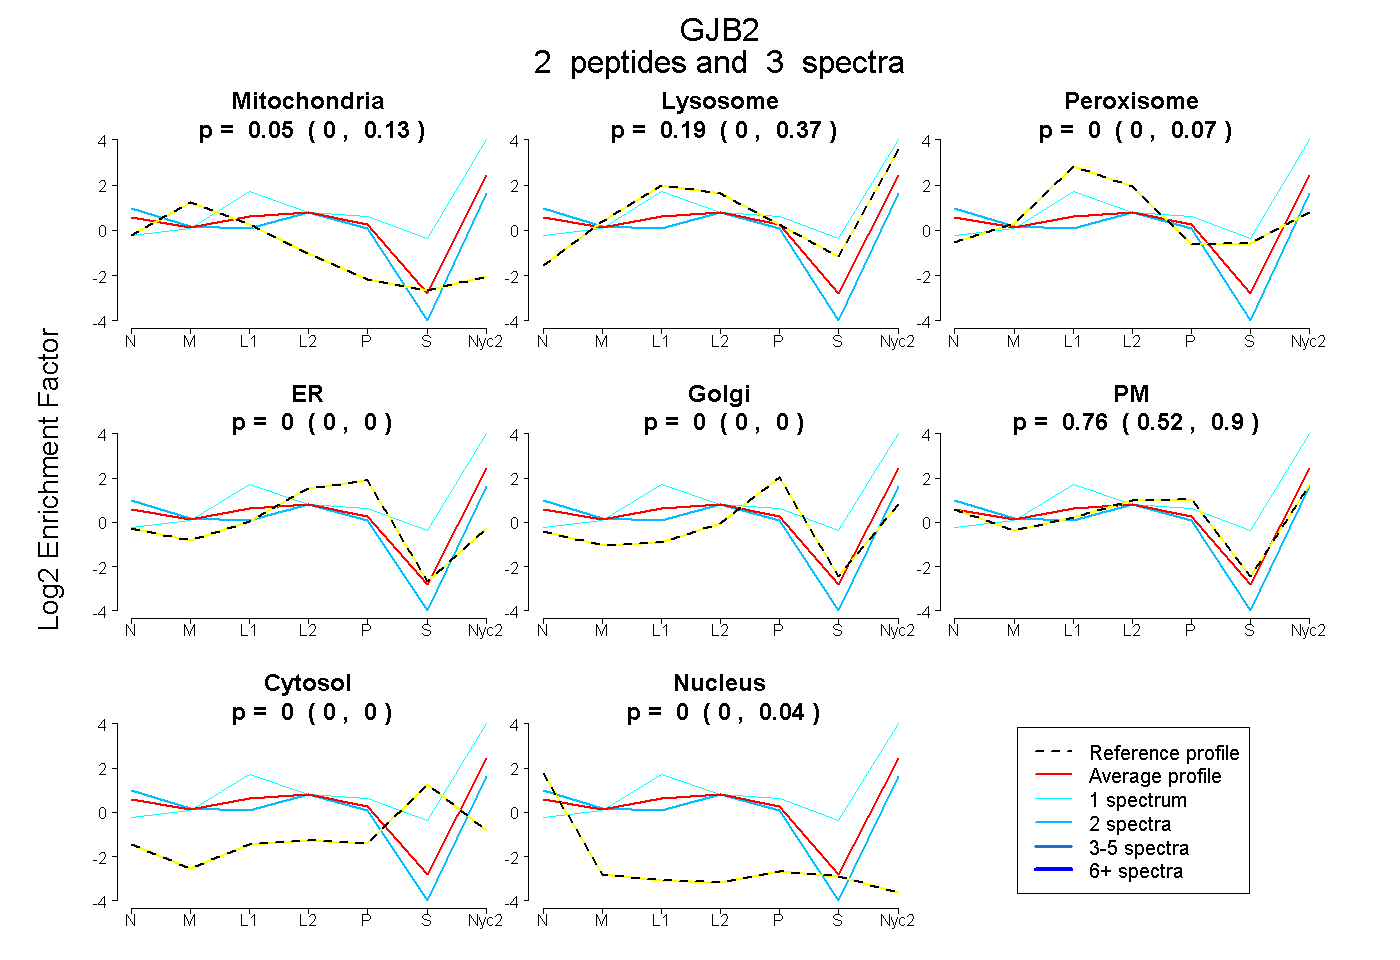
| Expt A |
2 peptides |
3 spectra |
|
0.053 0.000 | 0.127 |
0.185 0.000 | 0.365 |
0.000 0.000 | 0.070 |
0.000 0.000 | 0.000 |
0.000 0.000 | 0.000 |
0.762 0.524 | 0.901 |
0.000 0.000 | 0.000 |
0.000 0.000 | 0.040 |
||
| Plot | Lyso | Other | |||||||||||
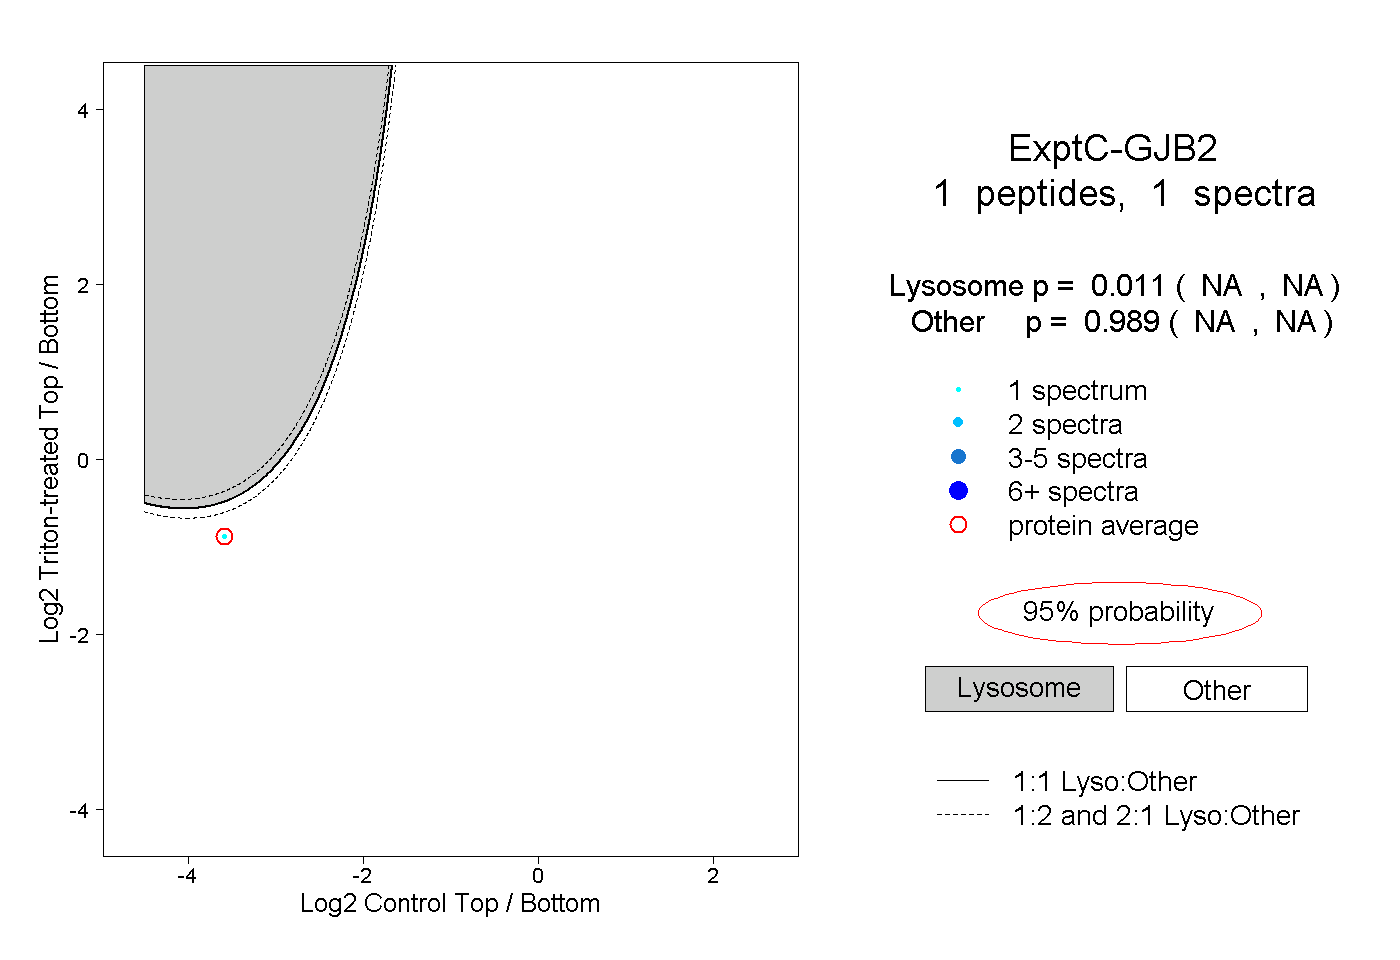
| Expt C |
1 peptide |
1 spectrum |
|
0.011 NA | NA |
0.989 NA | NA |