 6
6peptides
spectra
0.787 | 0.848
0.017 | 0.195
0.000 | 0.129
0.000 | 0.000
0.000 | 0.000
0.000 | 0.000
0.000 | 0.000
0.000 | 0.000
| Plot | Mito | Lyso | Perox | ER | Golgi | PM | Cytosol | Nucleus | |||||
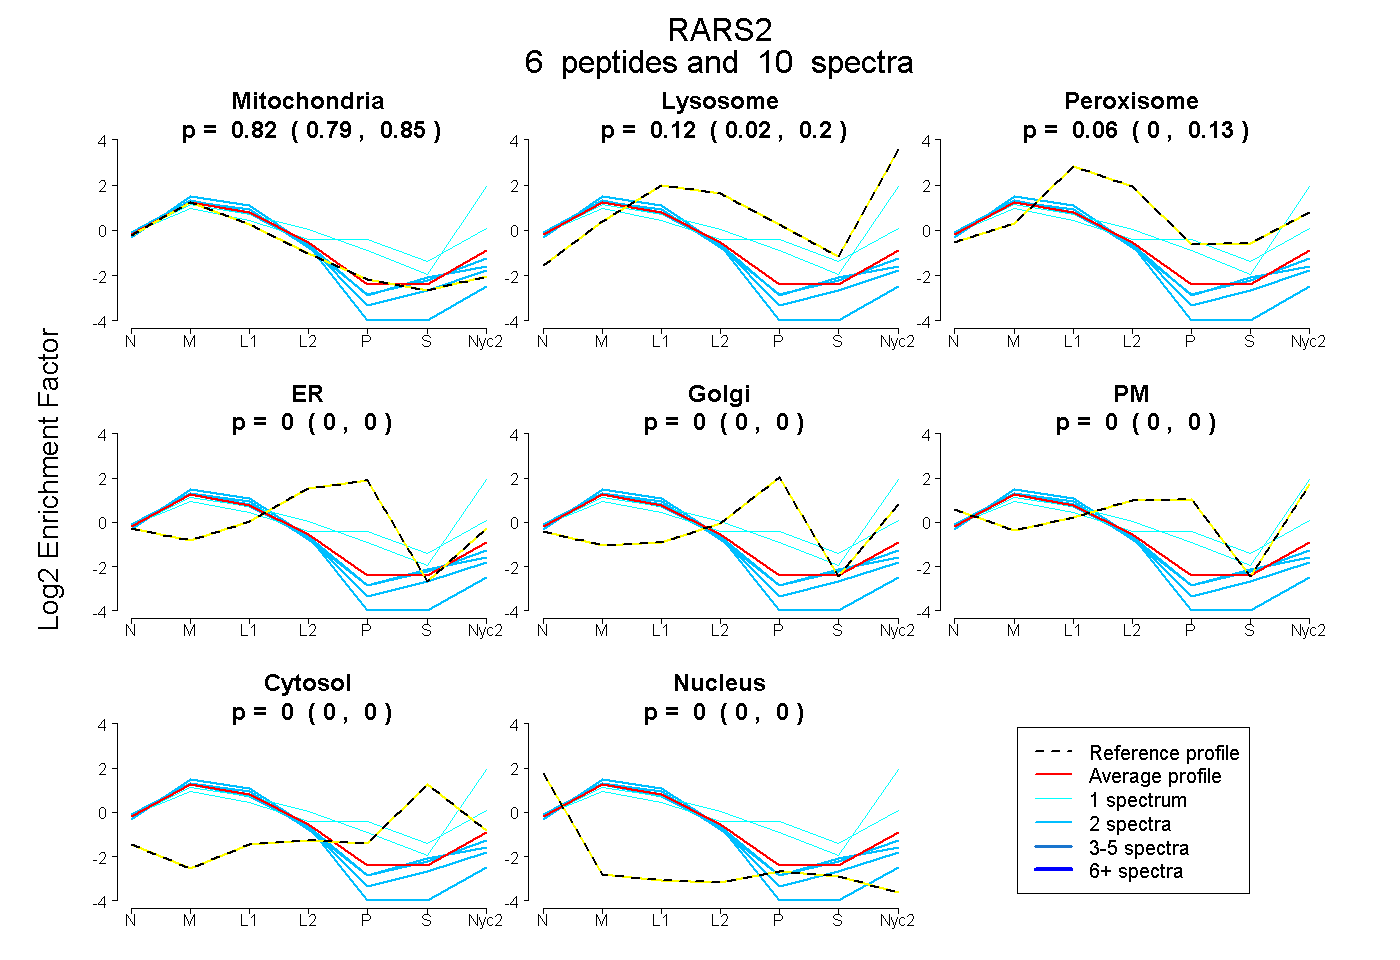
| Expt A |
6 peptides |
10 spectra |
|
0.821 0.787 | 0.848 |
0.117 0.017 | 0.195 |
0.062 0.000 | 0.129 |
0.000 0.000 | 0.000 |
0.000 0.000 | 0.000 |
0.000 0.000 | 0.000 |
0.000 0.000 | 0.000 |
0.000 0.000 | 0.000 |
| 2 spectra, SQLDTQDQAQR | 0.963 | 0.000 | 0.037 | 0.000 | 0.000 | 0.000 | 0.000 | 0.000 | ||
| 2 spectra, DSPPEVAGAR | 0.881 | 0.000 | 0.119 | 0.000 | 0.000 | 0.000 | 0.000 | 0.000 | ||
| 2 spectra, GLLLSDYQFSWDR | 0.856 | 0.000 | 0.144 | 0.000 | 0.000 | 0.000 | 0.000 | 0.000 | ||
| 2 spectra, LAHEFFHR | 1.000 | 0.000 | 0.000 | 0.000 | 0.000 | 0.000 | 0.000 | 0.000 | ||
| 1 spectrum, SIACQLSR | 0.361 | 0.472 | 0.000 | 0.000 | 0.000 | 0.160 | 0.000 | 0.006 | ||
| 1 spectrum, VGLAALIIQDFR | 0.468 | 0.199 | 0.026 | 0.000 | 0.066 | 0.166 | 0.075 | 0.000 |
| Plot | Mito | Lyso or Perox | ER | Golgi | PM | Cytosol | Nucleus | ||||||
| Expt B |
2 peptides |
2 spectra |
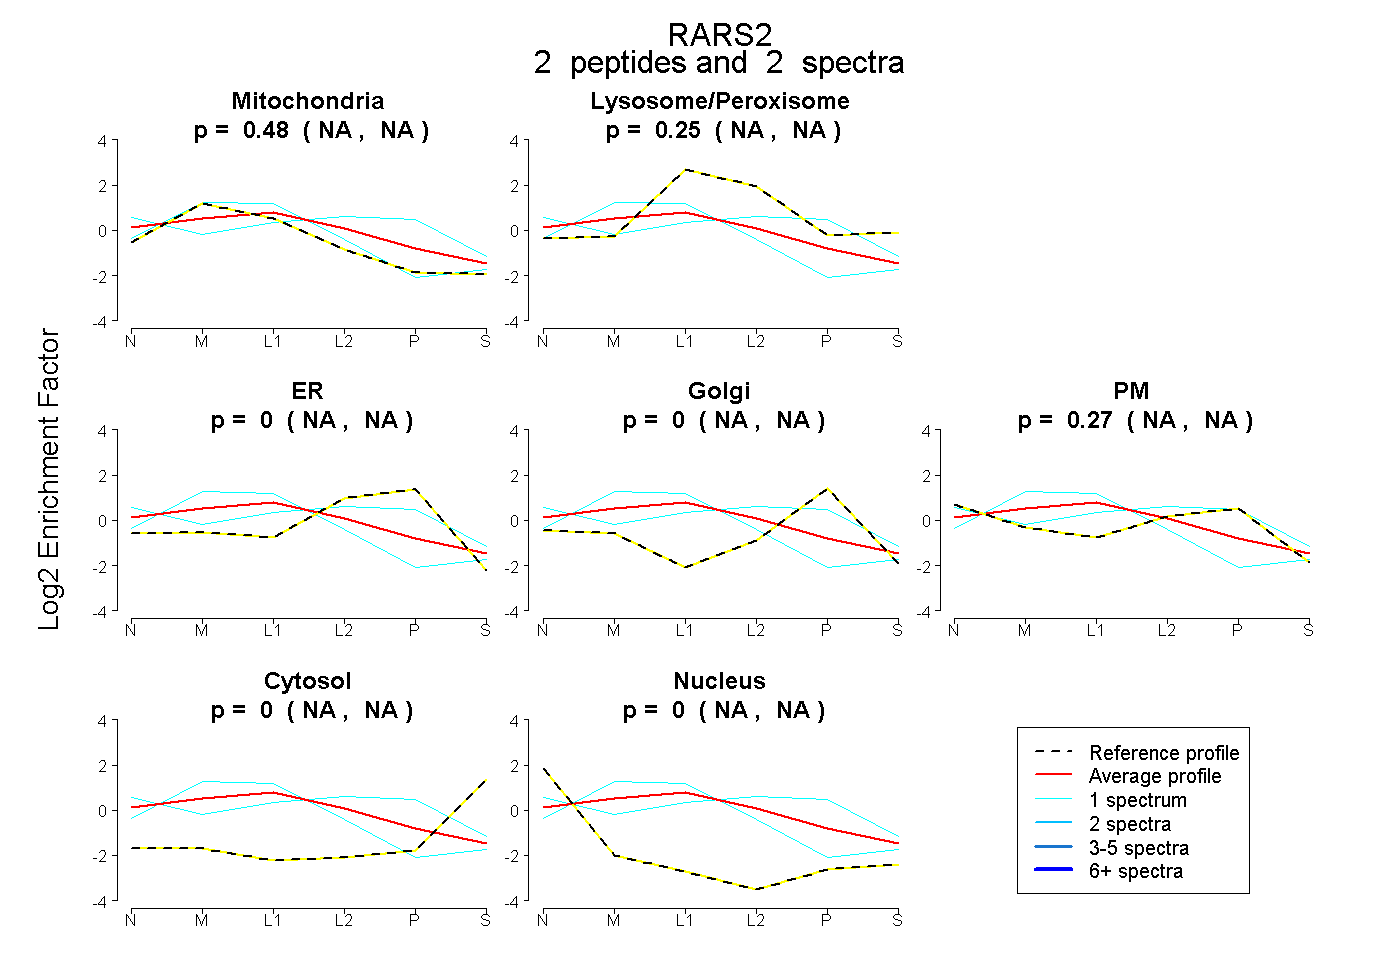 |
0.480 NA | NA |
0.245 NA | NA |
0.000 NA | NA |
0.000 NA | NA |
0.273 NA | NA |
0.000 NA | NA |
0.002 NA | NA |
|||
| Plot | Lyso | Other | |||||||||||
| Expt C |
18 peptides |
73 spectra |
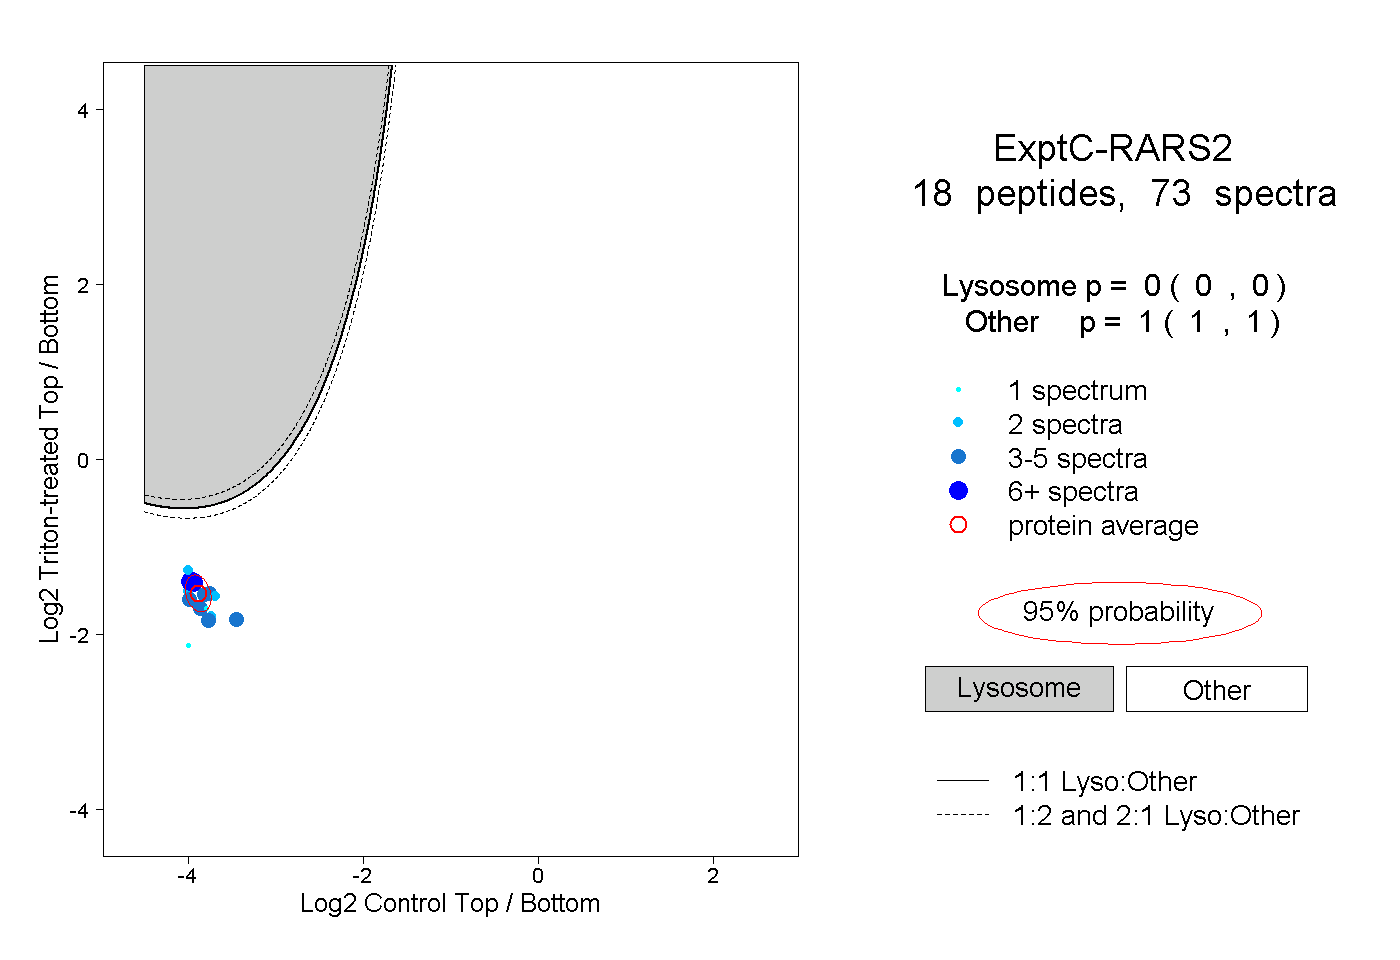 |
0.000 0.000 | 0.000 |
1.000 1.000 | 1.000 |
||||||||
| Plot | Lyso | Other | |||||||||||
| Expt D |
3 peptides |
6 spectra |
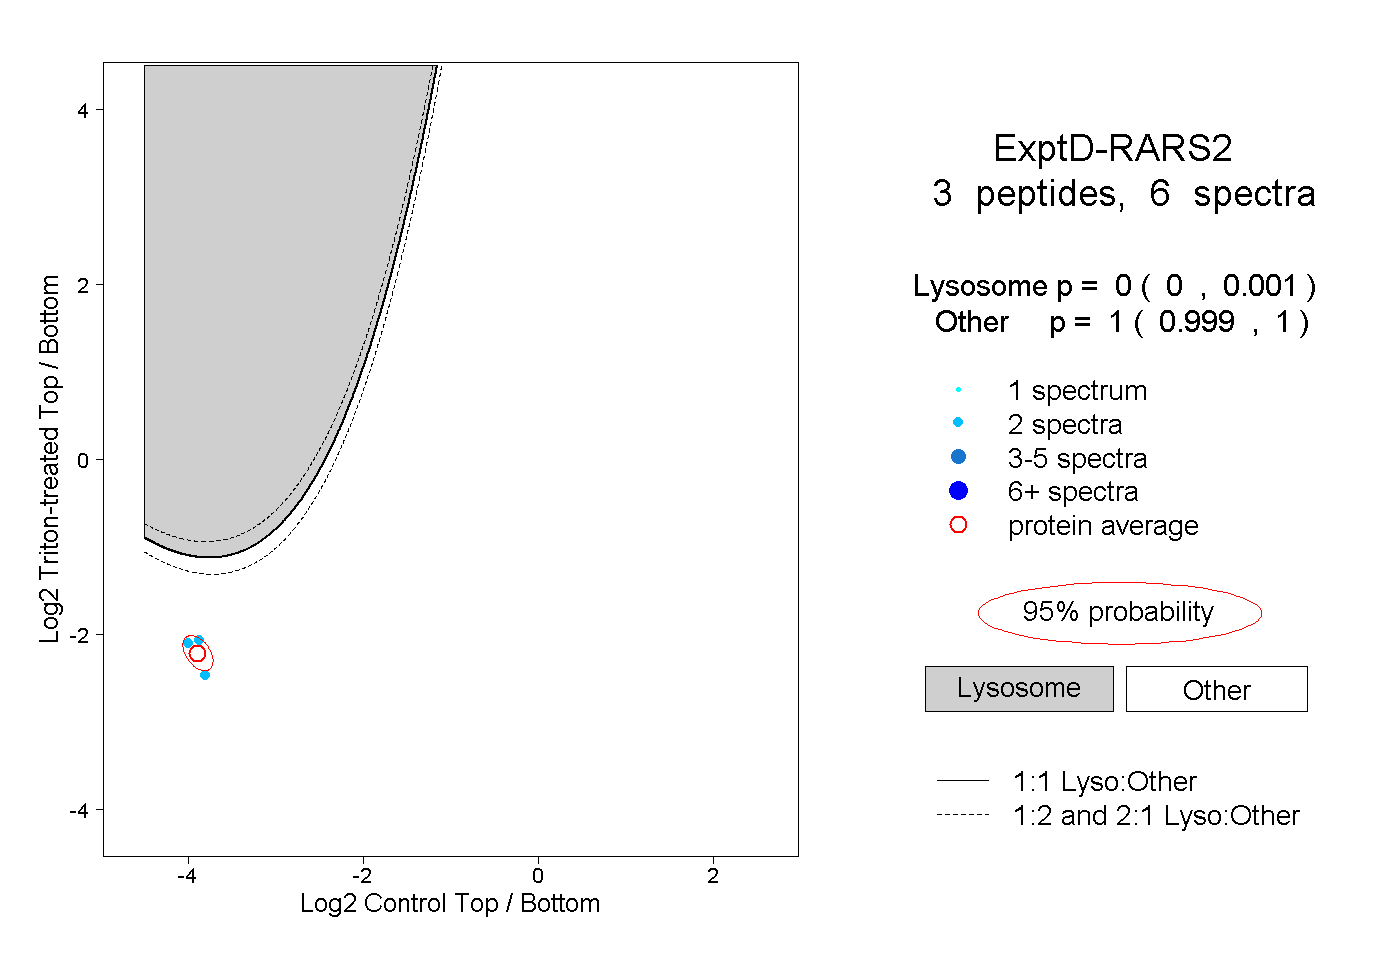 |
0.000 0.000 | 0.001 |
1.000 0.999 | 1.000 |