 1
1peptide
spectra
0.000 | 0.000
0.000 | 0.000
0.000 | 0.000
0.000 | 0.061
0.000 | 0.062
0.000 | 0.000
0.477 | 0.503
0.434 | 0.481
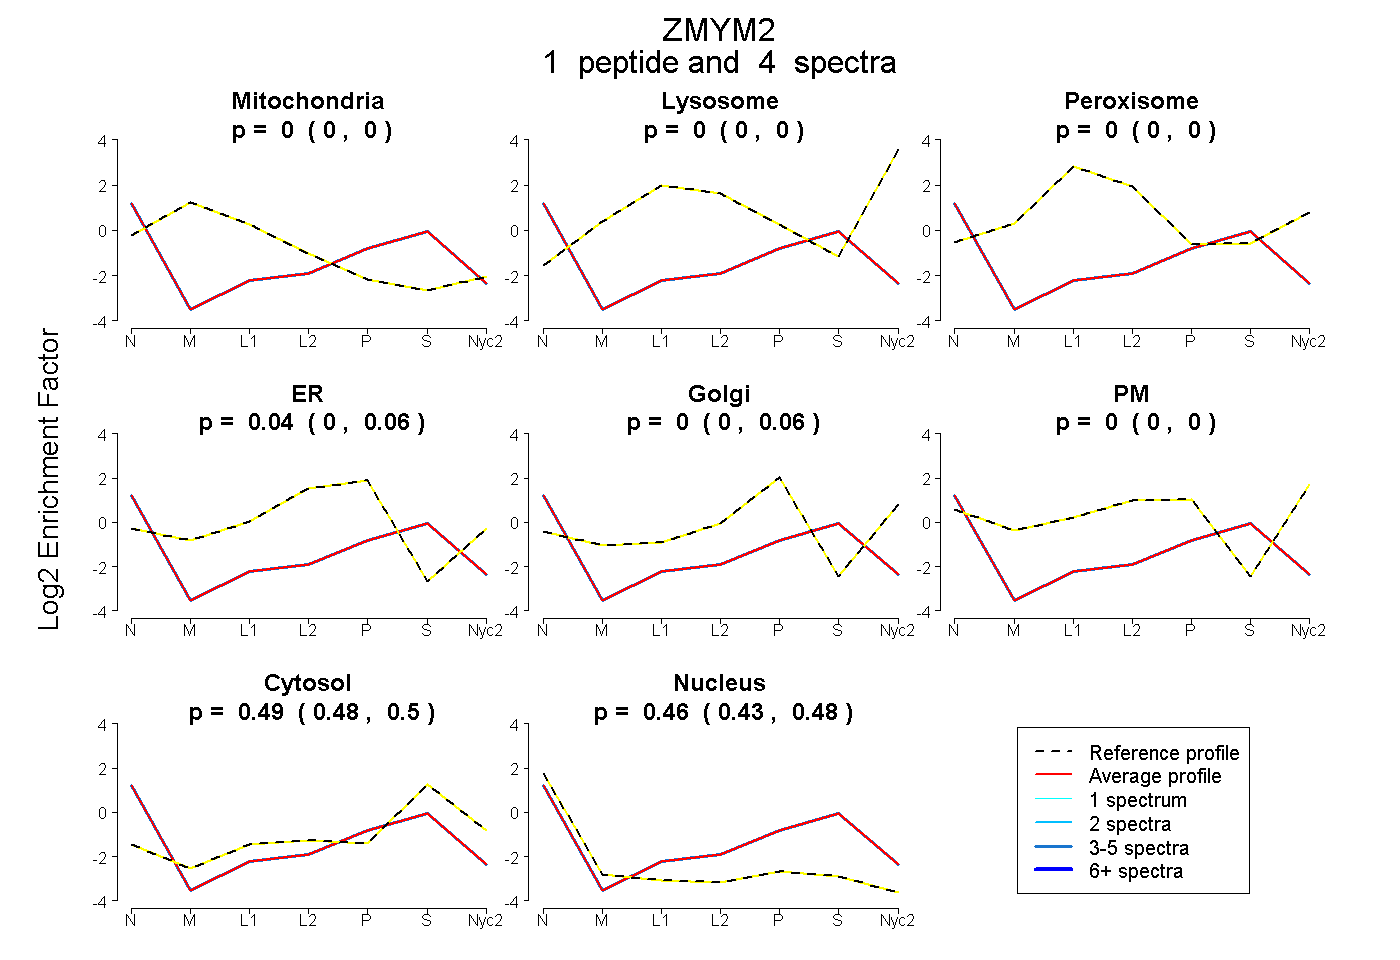
| Plot | Mito | Lyso | Perox | ER | Golgi | PM | Cytosol | Nucleus | |||||
| Expt A |
1 peptide |
4 spectra |
|
0.000 0.000 | 0.000 |
0.000 0.000 | 0.000 |
0.000 0.000 | 0.000 |
0.044 0.000 | 0.061 |
0.002 0.000 | 0.062 |
0.000 0.000 | 0.000 |
0.494 0.477 | 0.503 |
0.460 0.434 | 0.481 |
| 4 spectra, GQTAYQR | 0.000 | 0.000 | 0.000 | 0.044 | 0.002 | 0.000 | 0.494 | 0.460 |