 1
1peptide
spectrum
NA | NA
NA | NA
NA | NA
NA | NA
NA | NA
NA | NA
NA | NA
NA | NA
| Plot | Mito | Lyso | Perox | ER | Golgi | PM | Cytosol | Nucleus | |||||
| Expt A |
1 peptide |
1 spectrum |
|
0.169 NA | NA |
0.237 NA | NA |
0.099 NA | NA |
0.000 NA | NA |
0.000 NA | NA |
0.000 NA | NA |
0.495 NA | NA |
0.000 NA | NA |
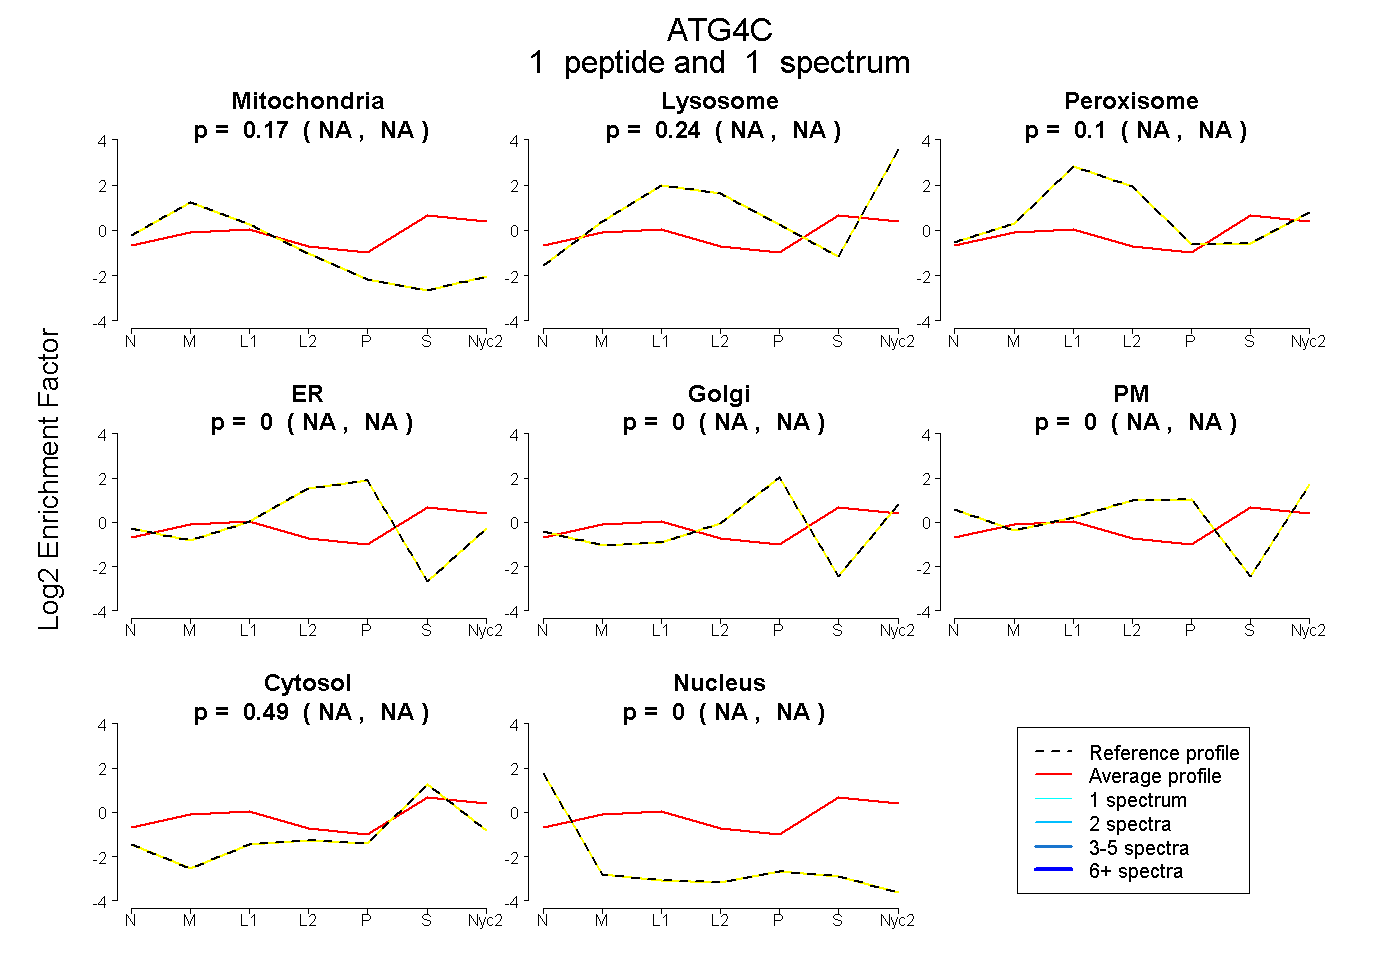
| 1 spectrum, AVIILVPVR | 0.169 | 0.237 | 0.099 | 0.000 | 0.000 | 0.000 | 0.495 | 0.000 |
| Plot | Lyso | Other | |||||||||||
| Expt C |
2 peptides |
3 spectra |
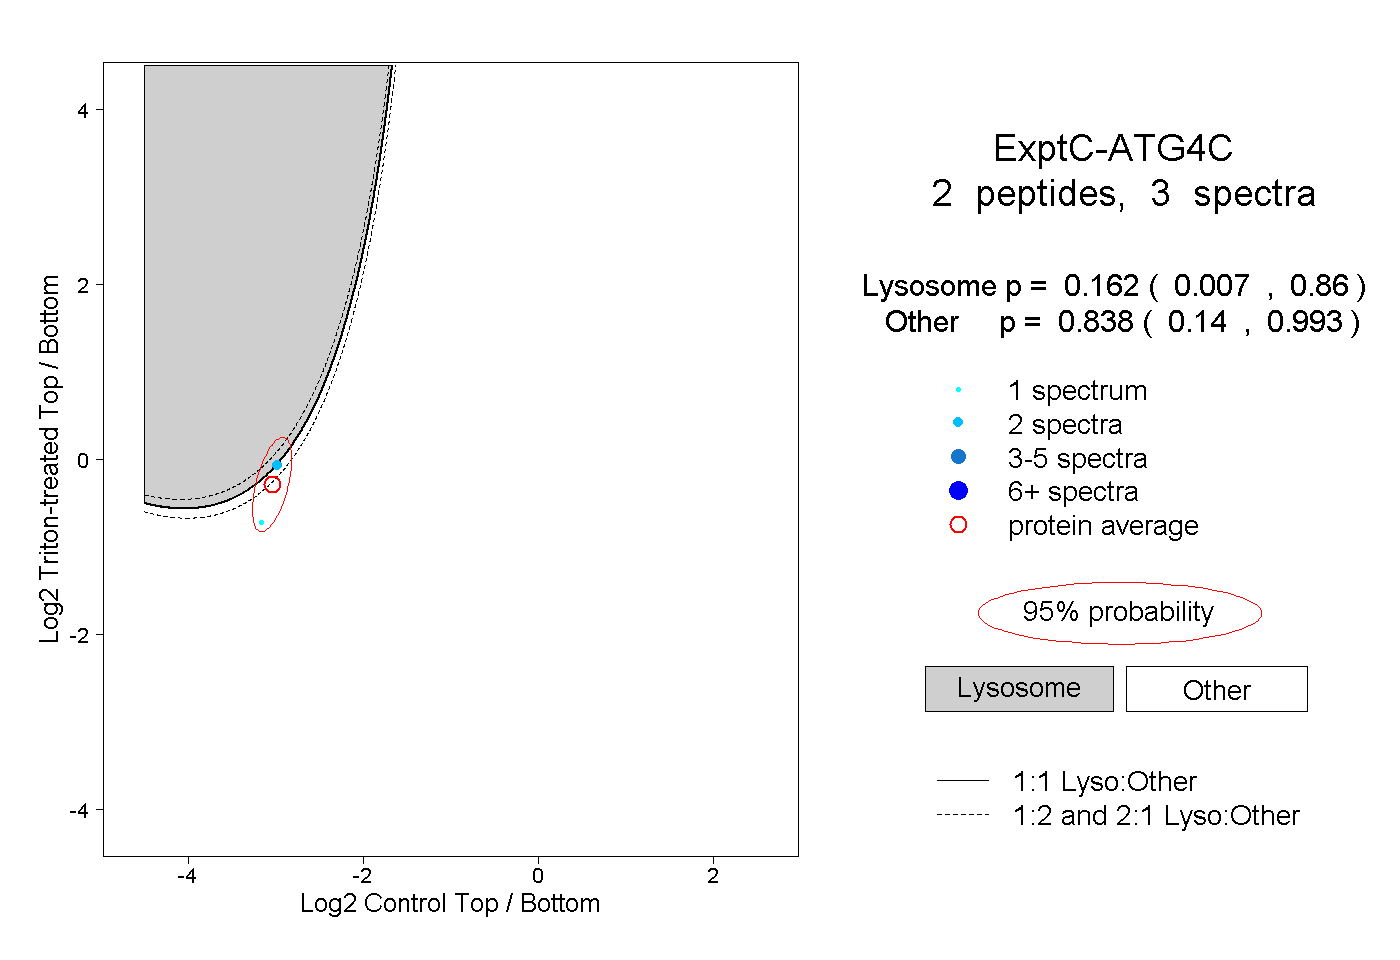 |
0.162 0.007 | 0.860 |
0.838 0.140 | 0.993 |