 3
3peptides
spectra
0.228 | 0.449
0.000 | 0.043
0.000 | 0.142
0.000 | 0.000
0.000 | 0.000
0.158 | 0.300
0.221 | 0.378
0.000 | 0.098
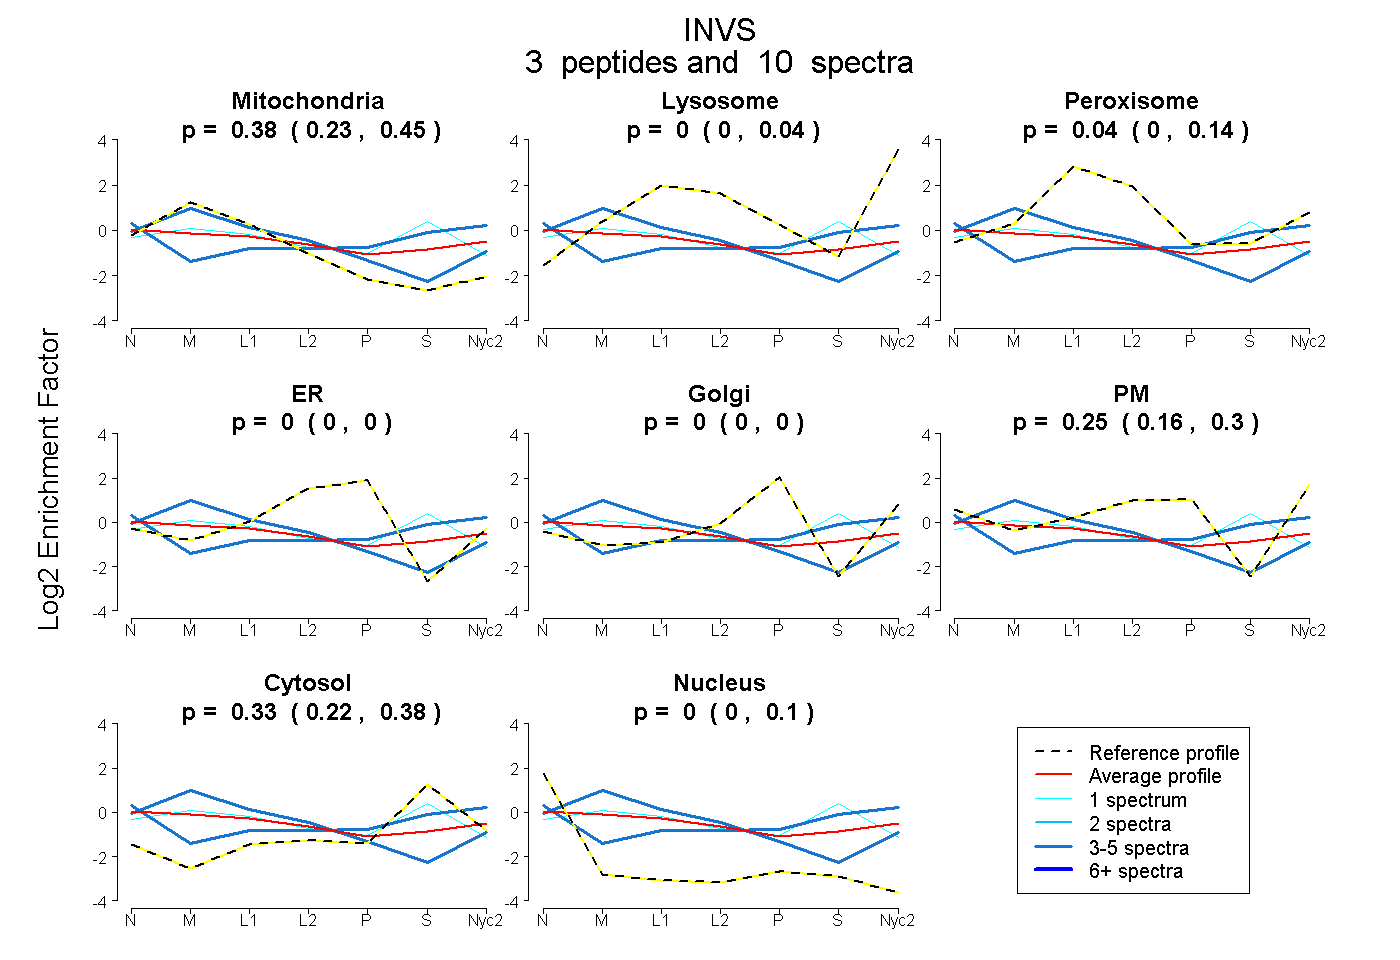
| Plot | Mito | Lyso | Perox | ER | Golgi | PM | Cytosol | Nucleus | |||||
| Expt A |
3 peptides |
10 spectra |
|
0.380 0.228 | 0.449 |
0.000 0.000 | 0.043 |
0.044 0.000 | 0.142 |
0.000 0.000 | 0.000 |
0.000 0.000 | 0.000 |
0.247 0.158 | 0.300 |
0.325 0.221 | 0.378 |
0.004 0.000 | 0.098 |
| 5 spectra, HTPLFR | 0.710 | 0.042 | 0.000 | 0.000 | 0.000 | 0.219 | 0.029 | 0.000 | ||
| 1 spectrum, AGADVNK | 0.336 | 0.000 | 0.198 | 0.000 | 0.000 | 0.000 | 0.466 | 0.000 | ||
| 4 spectra, LLLTR | 0.000 | 0.000 | 0.044 | 0.000 | 0.000 | 0.359 | 0.504 | 0.093 |
| Plot | Mito | Lyso or Perox | ER | Golgi | PM | Cytosol | Nucleus | ||||||
| Expt B |
1 peptide |
1 spectrum |
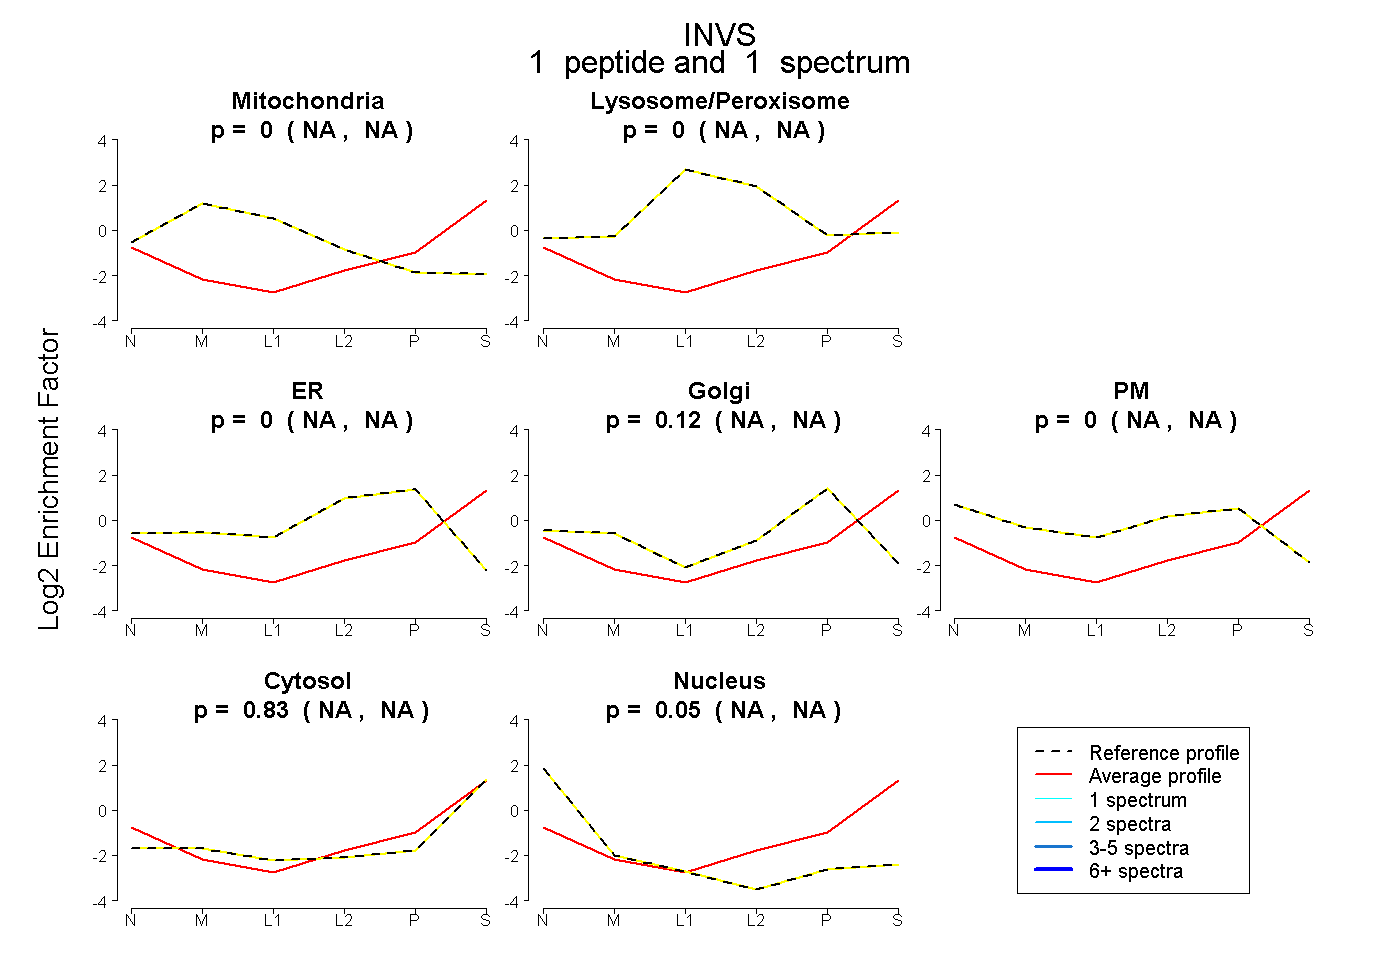 |
0.000 NA | NA |
0.000 NA | NA |
0.000 NA | NA |
0.119 NA | NA |
0.000 NA | NA |
0.831 NA | NA |
0.050 NA | NA |
|||
| Plot | Lyso | Other | |||||||||||
| Expt C |
4 peptides |
22 spectra |
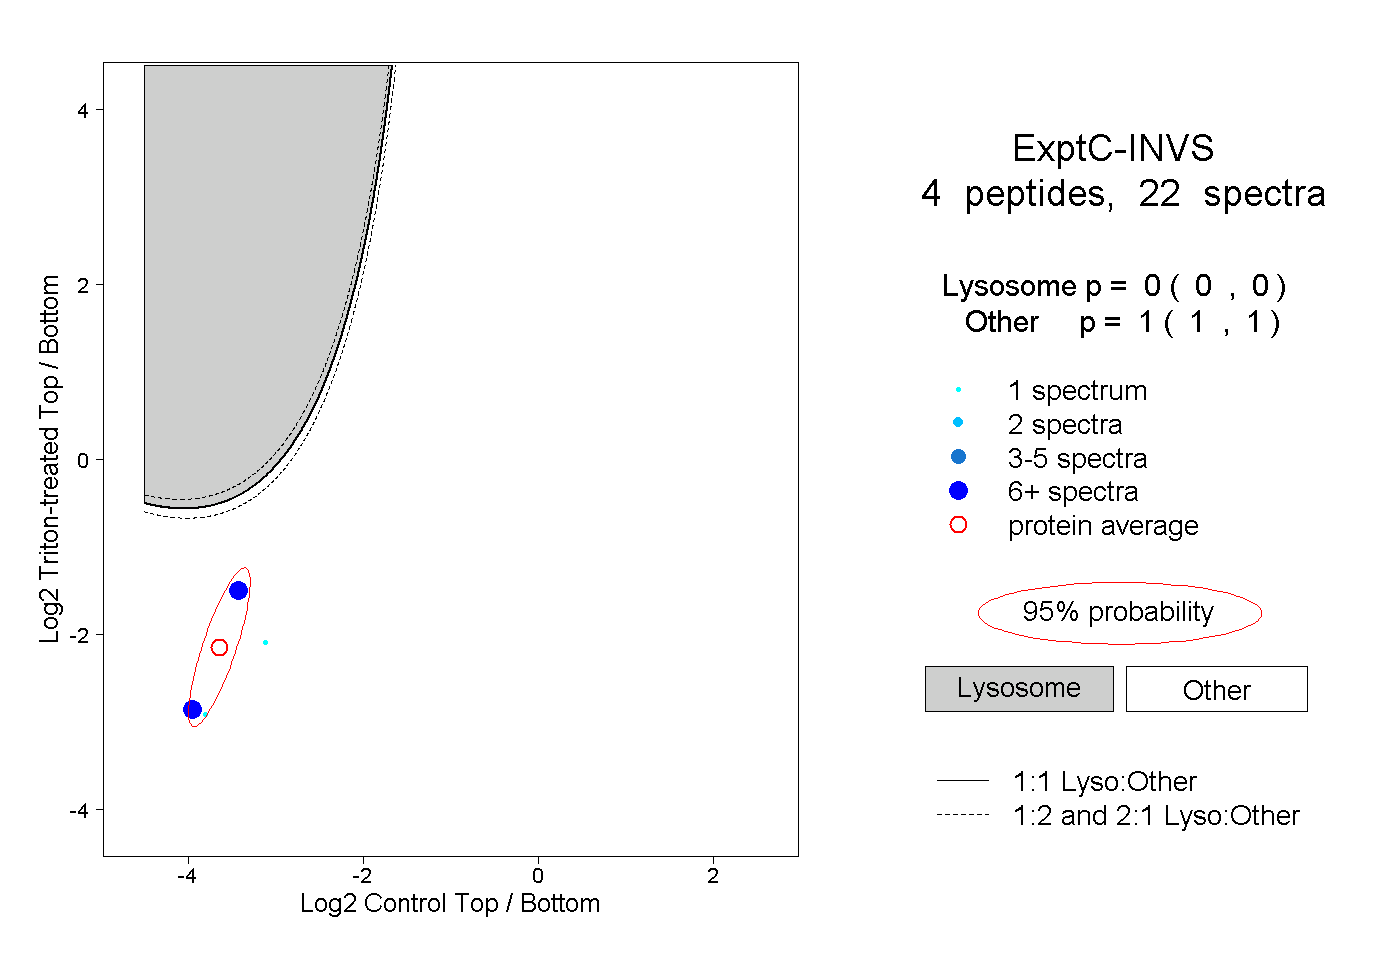 |
0.000 0.000 | 0.000 |
1.000 1.000 | 1.000 |
||||||||
| Plot | Lyso | Other | |||||||||||
| Expt D |
1 peptide |
8 spectra |
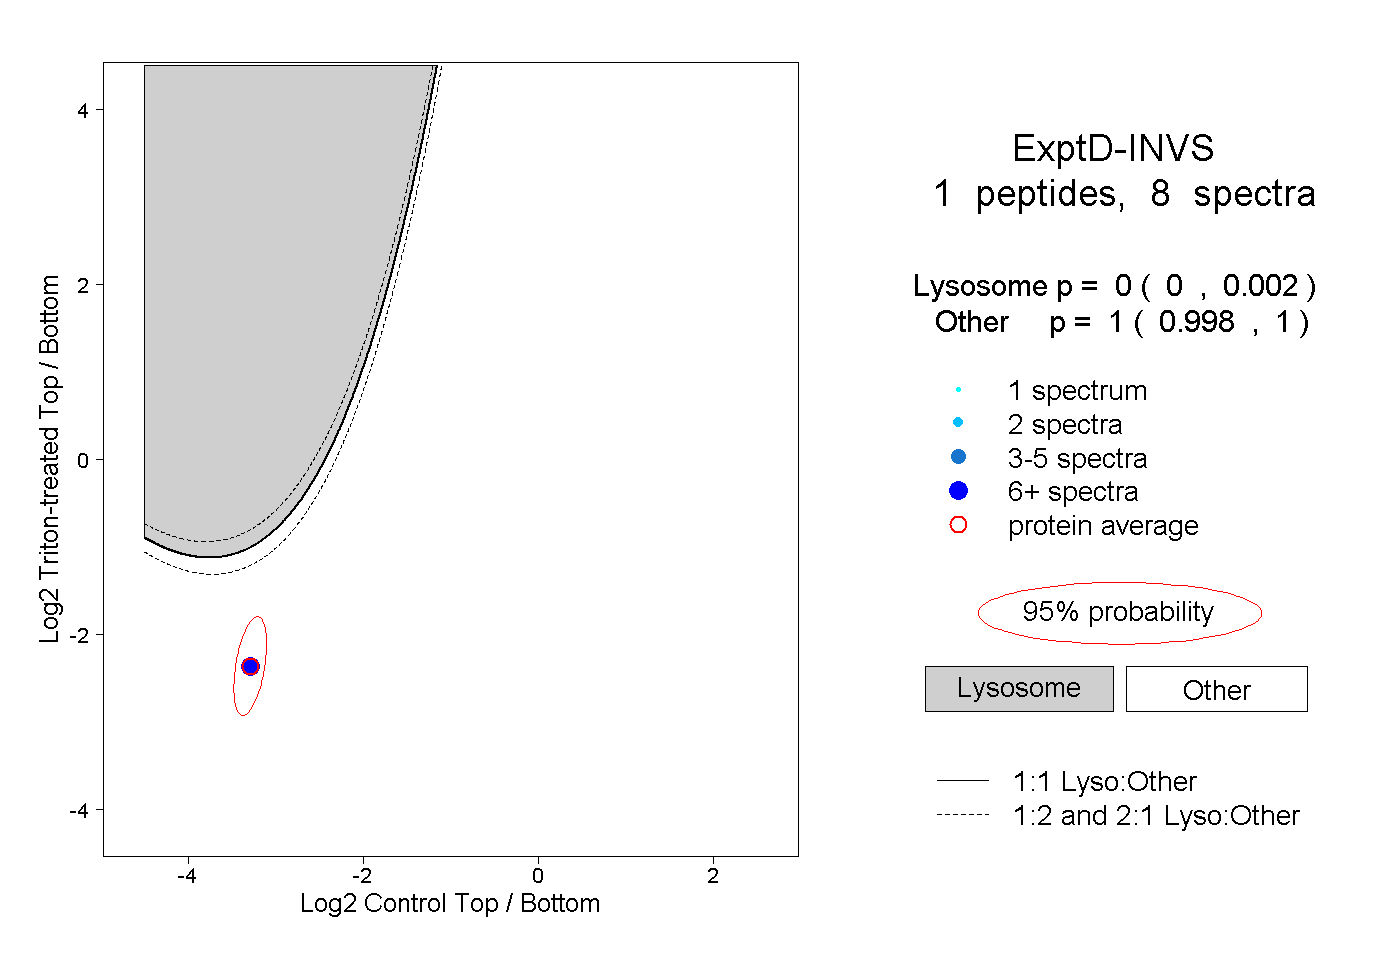 |
0.000 0.000 | 0.002 |
1.000 0.998 | 1.000 |