 24
24peptides
spectra
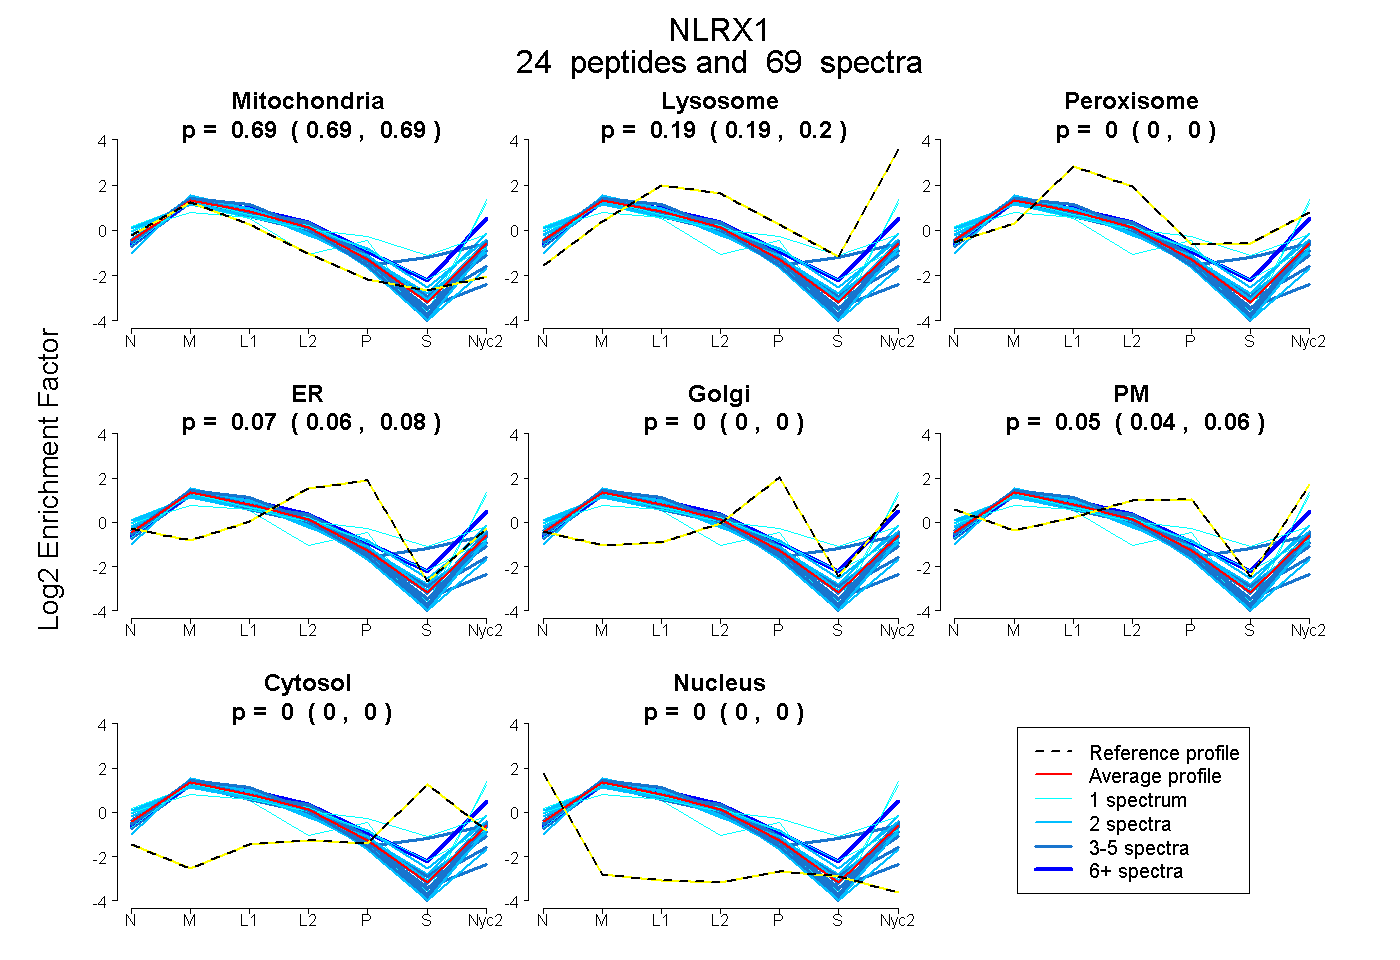
0.686 | 0.693
0.187 | 0.197
0.000 | 0.000
0.055 | 0.075
0.000 | 0.000
0.039 | 0.063
0.000 | 0.000
0.000 | 0.000
17peptides
spectra
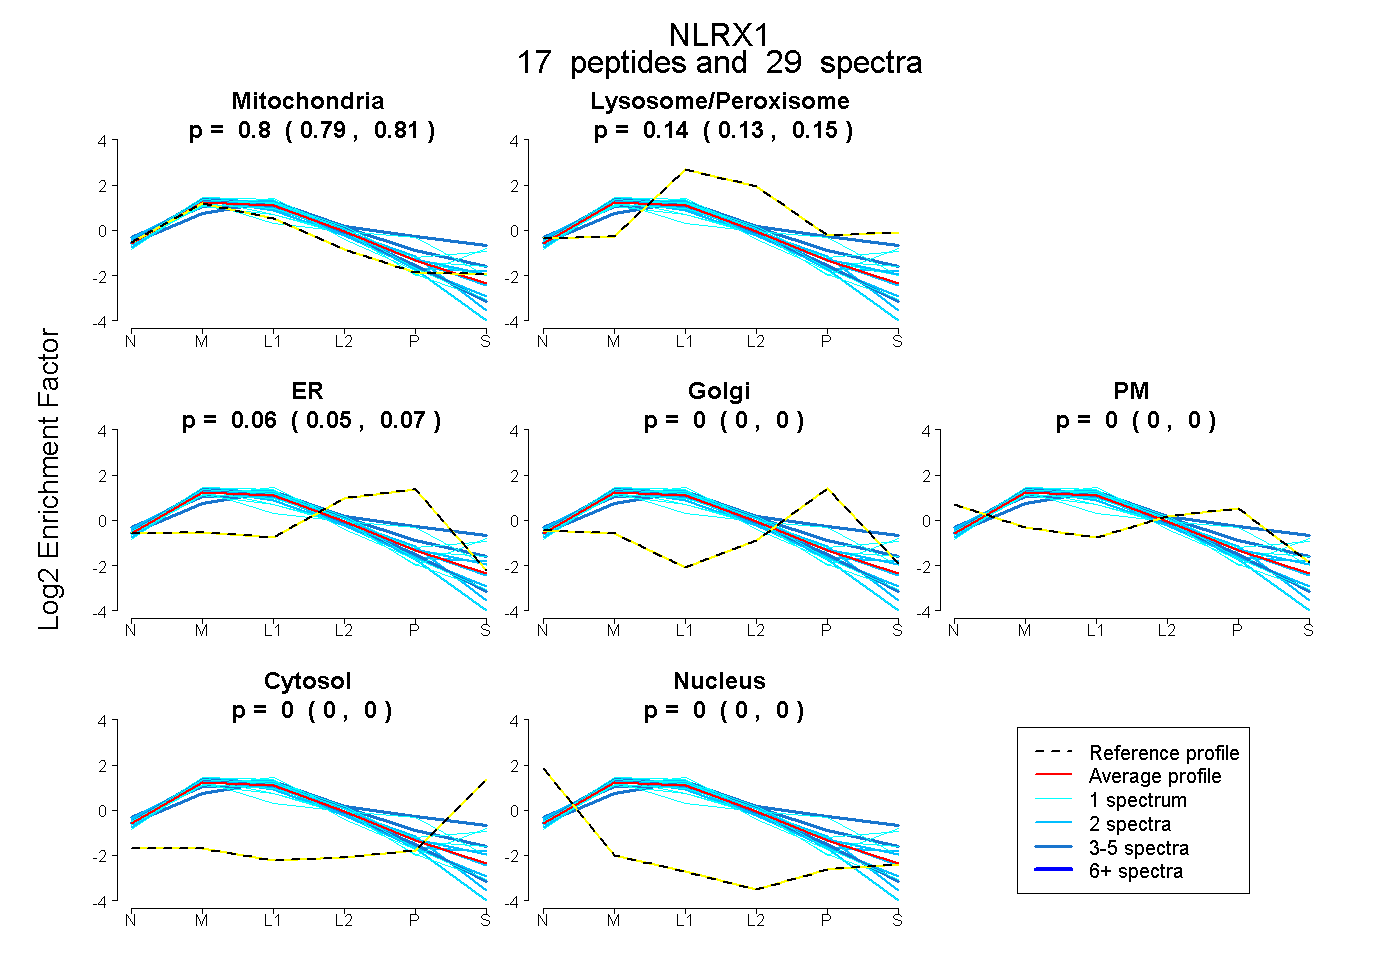
0.793 | 0.810
0.127 | 0.149
0.048 | 0.069
0.000 | 0.000
0.000 | 0.000
0.000 | 0.000
0.000 | 0.000
32peptides
spectra
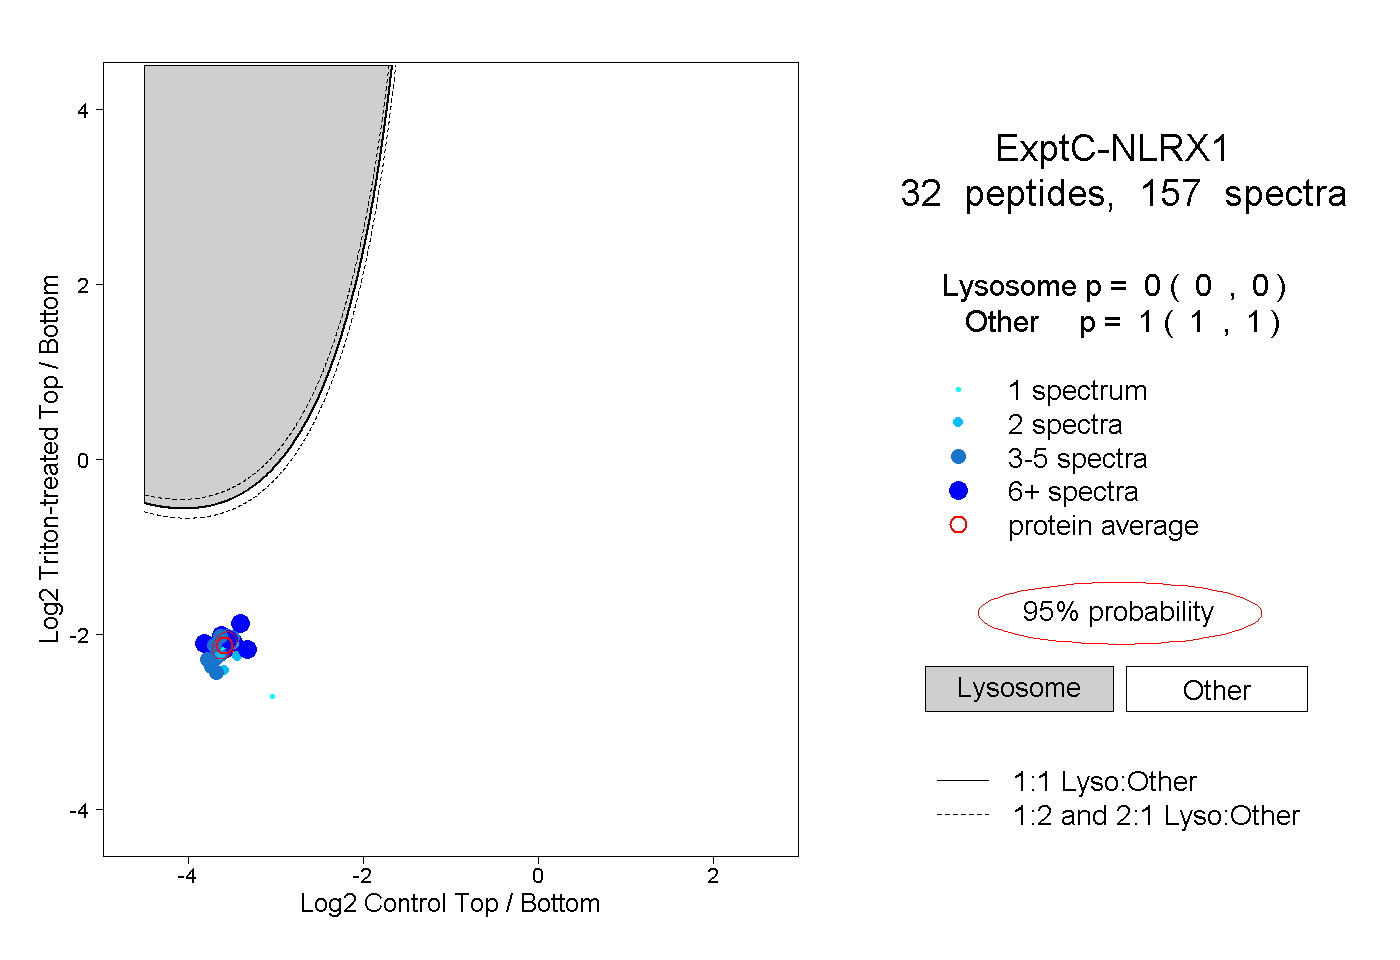
0.000 | 0.000
1.000 | 1.000
11peptides
spectra
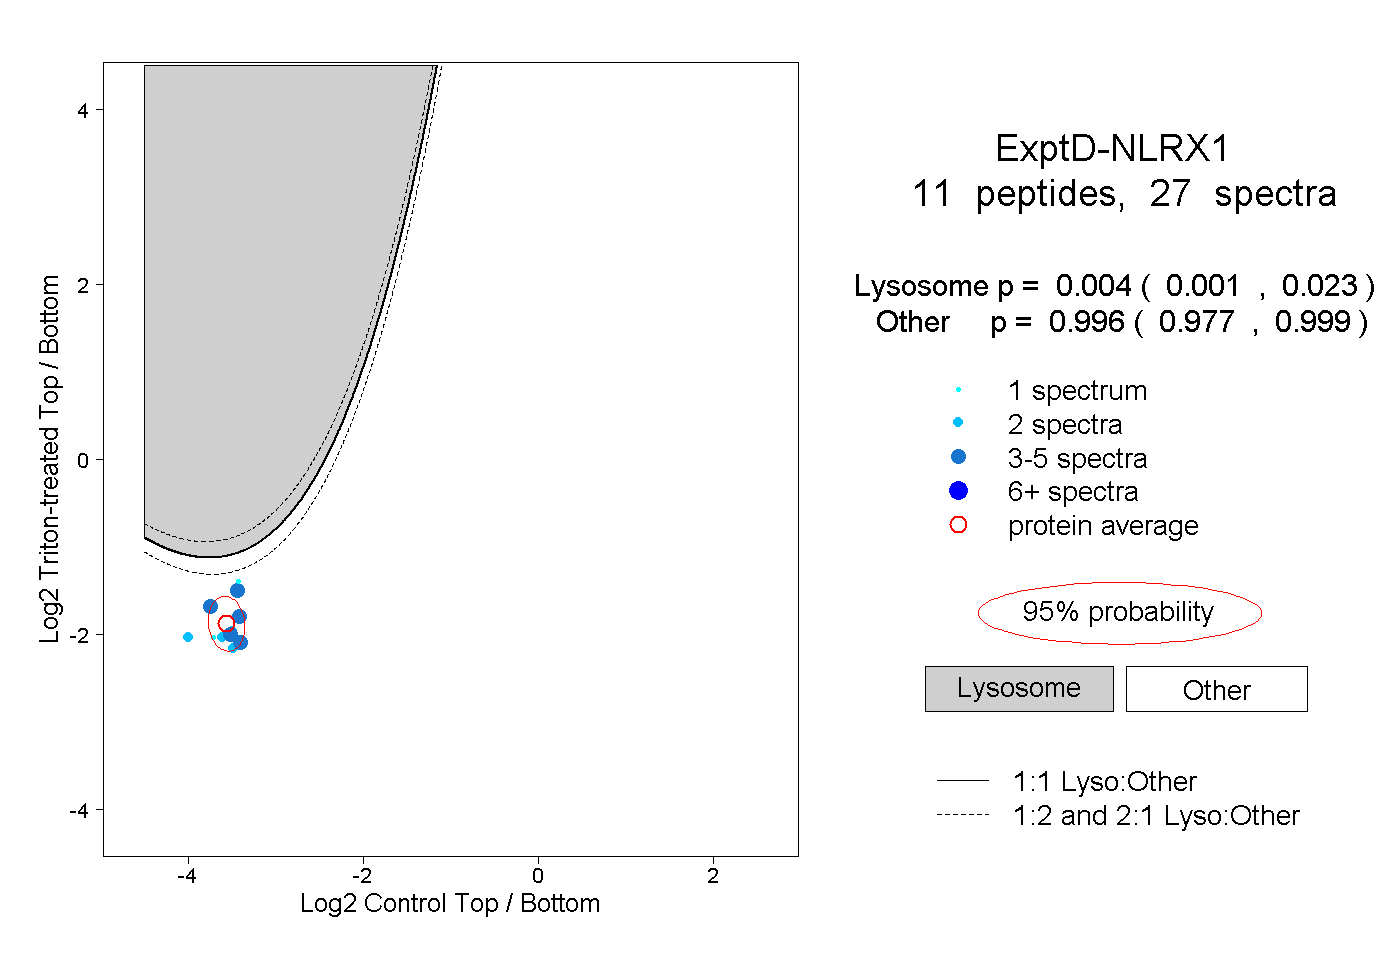
0.001 | 0.023
0.977 | 0.999