 5
5peptides
spectra
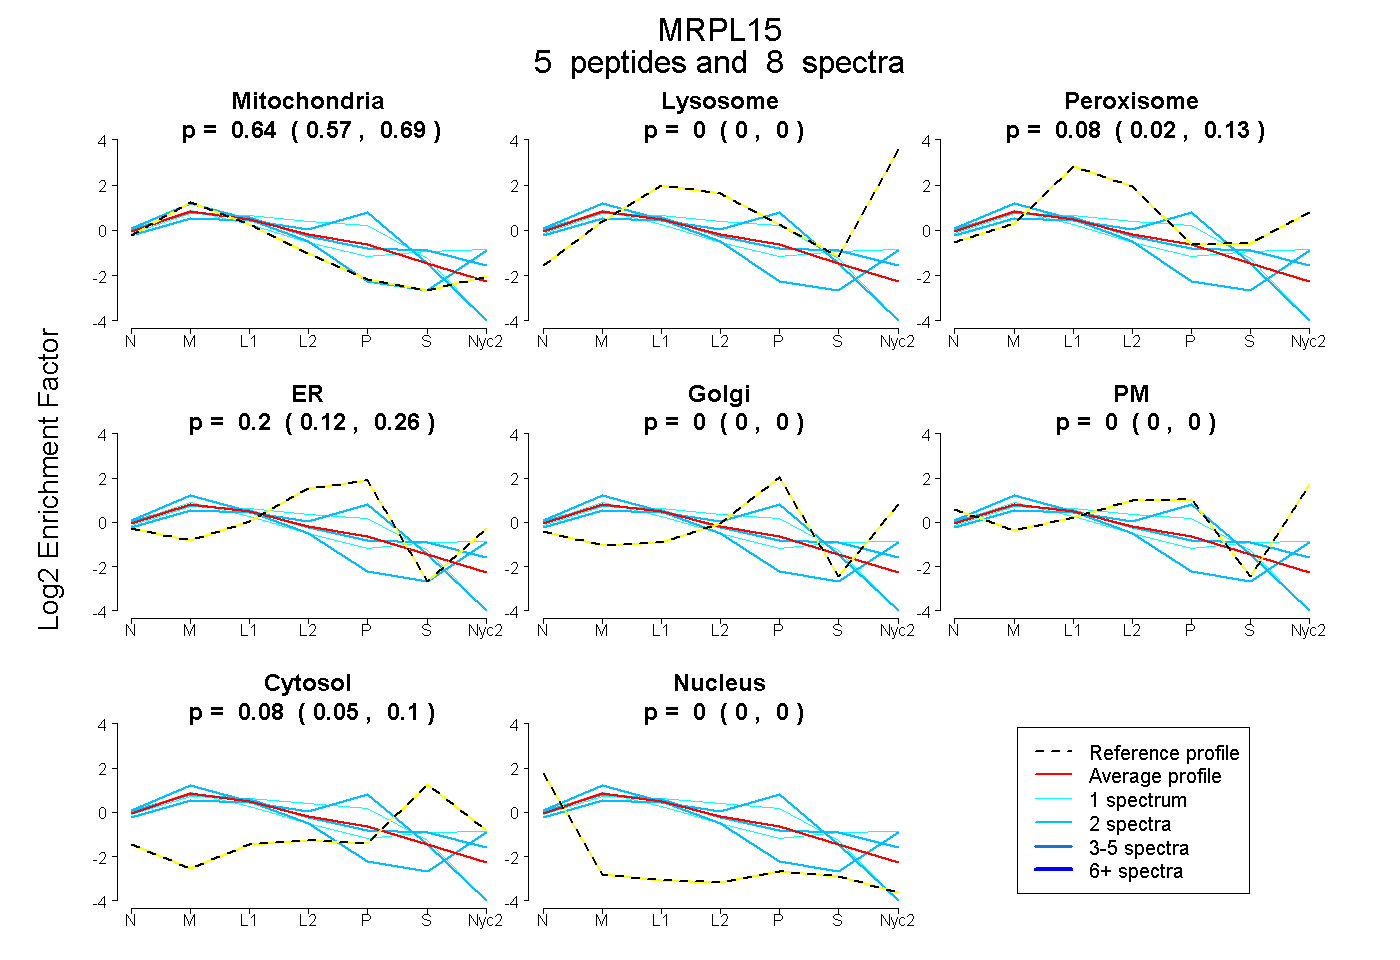
0.575 | 0.690
0.000 | 0.000
0.024 | 0.134
0.118 | 0.257
0.000 | 0.000
0.000 | 0.000
0.051 | 0.105
0.000 | 0.000
2peptides
spectra
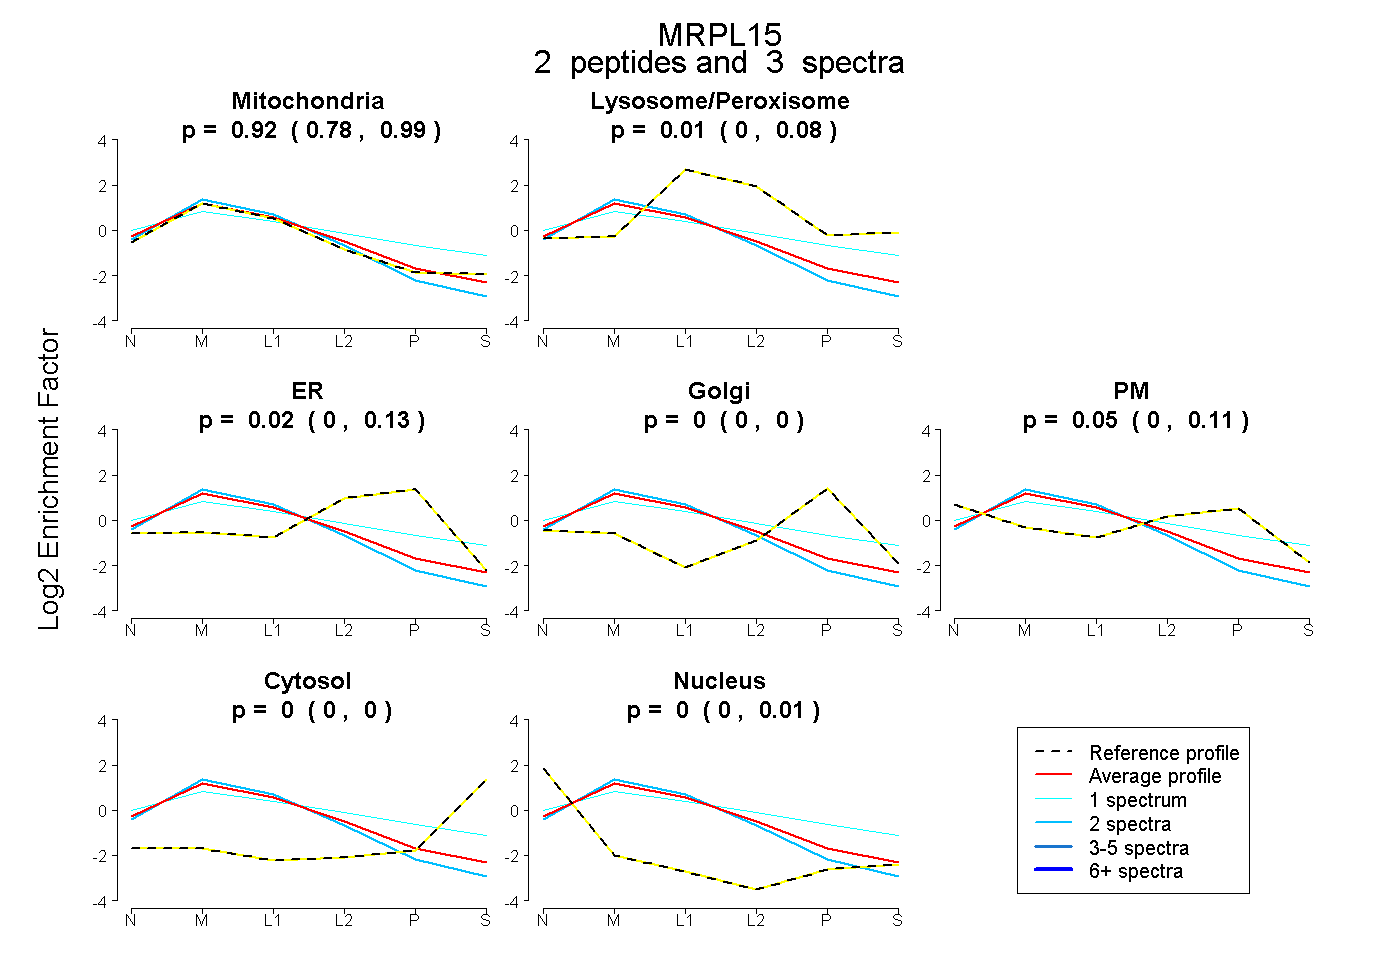
0.784 | 0.990
0.000 | 0.078
0.000 | 0.127
0.000 | 0.000
0.000 | 0.115
0.000 | 0.000
0.000 | 0.015
7peptides
spectra
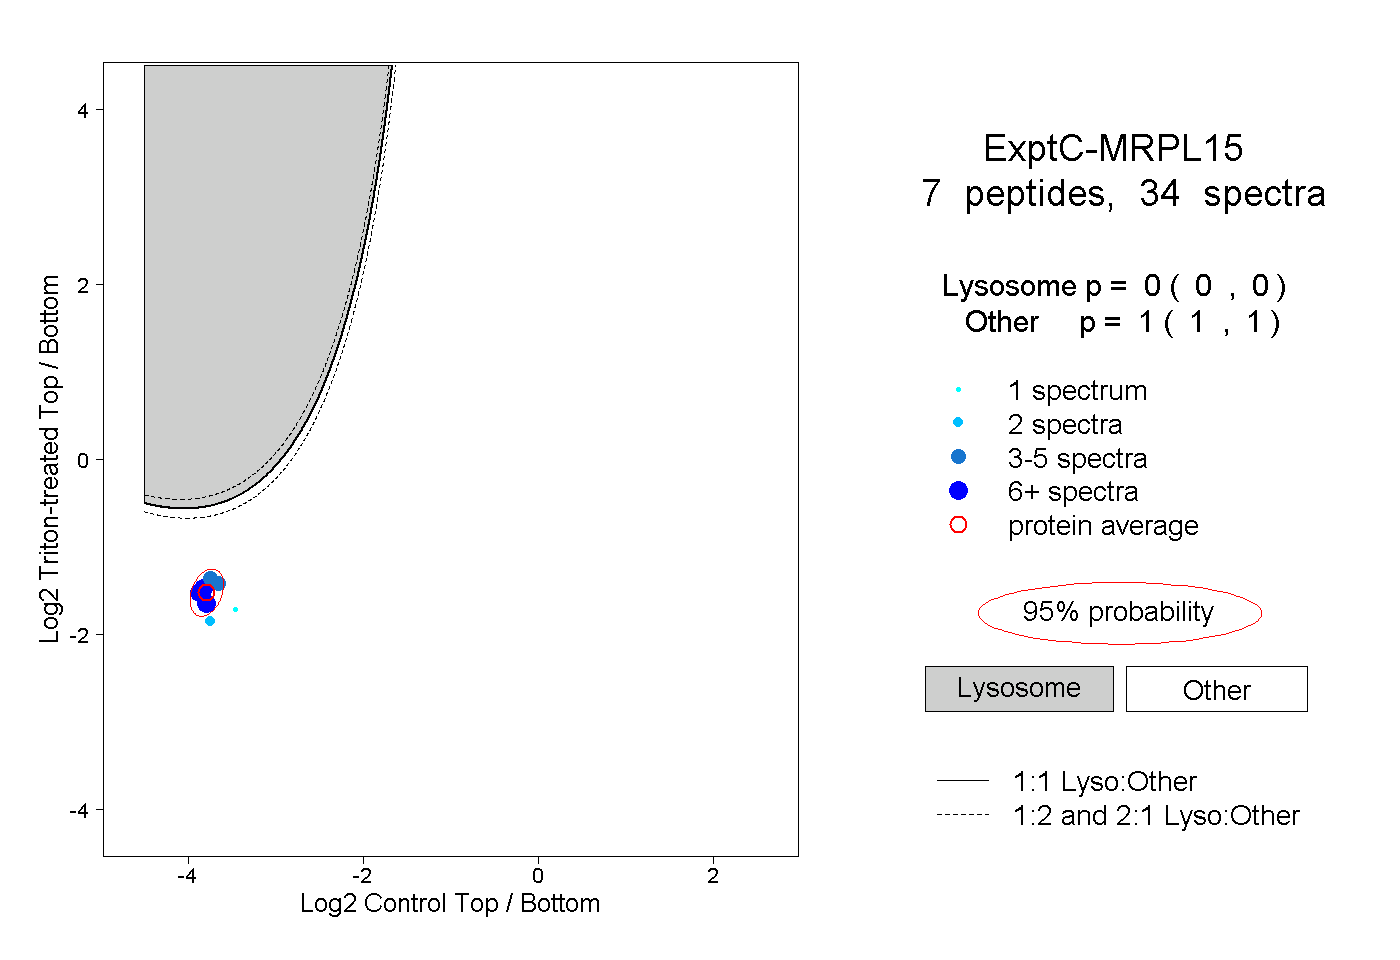
0.000 | 0.000
1.000 | 1.000
2peptides
spectra
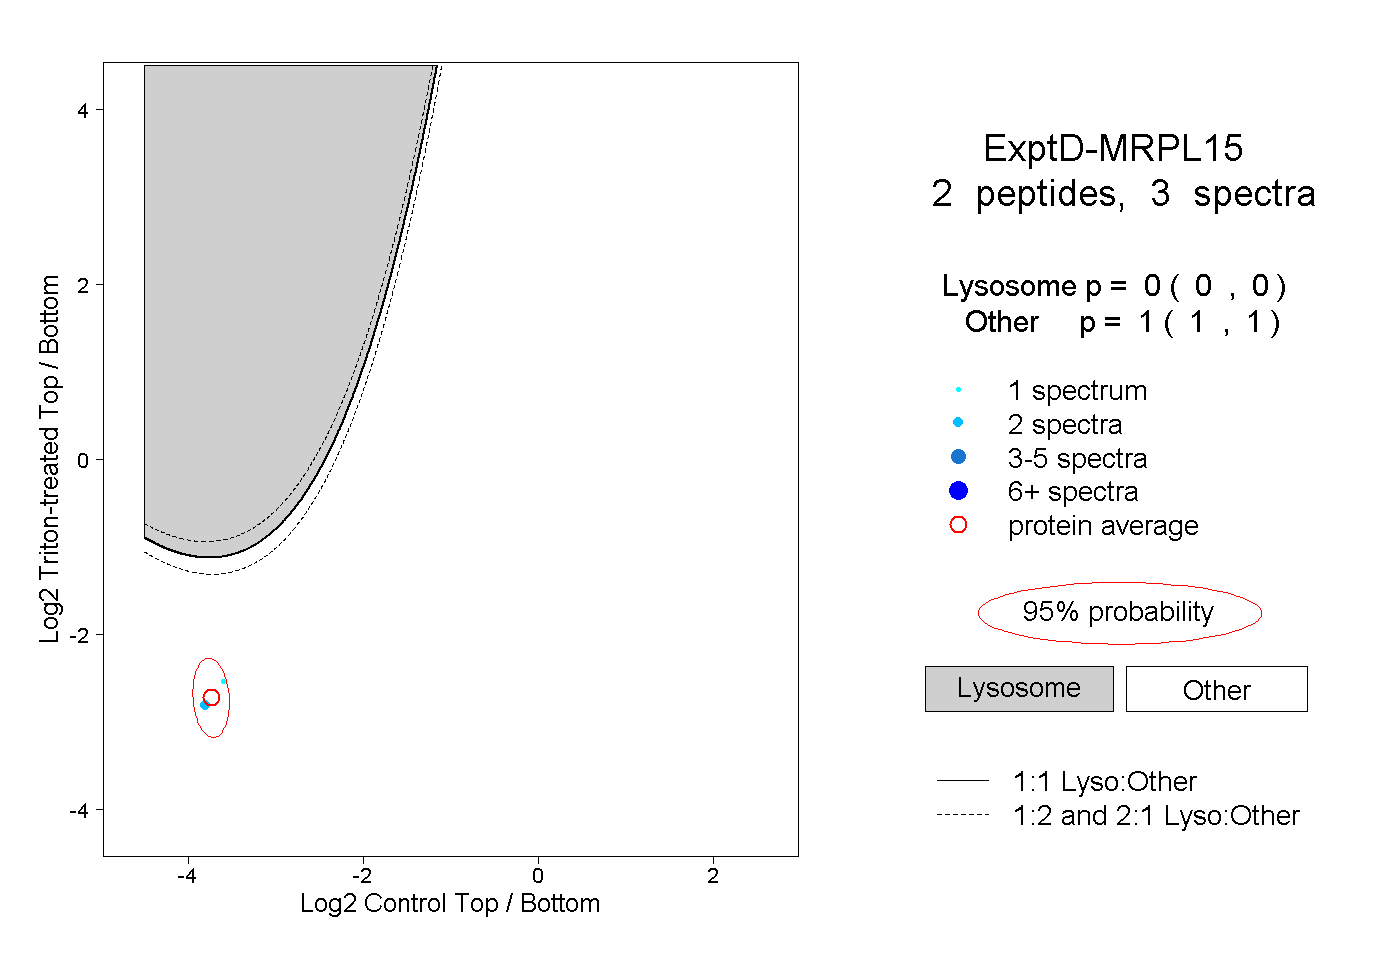
0.000 | 0.000
1.000 | 1.000