7
7peptides
spectra
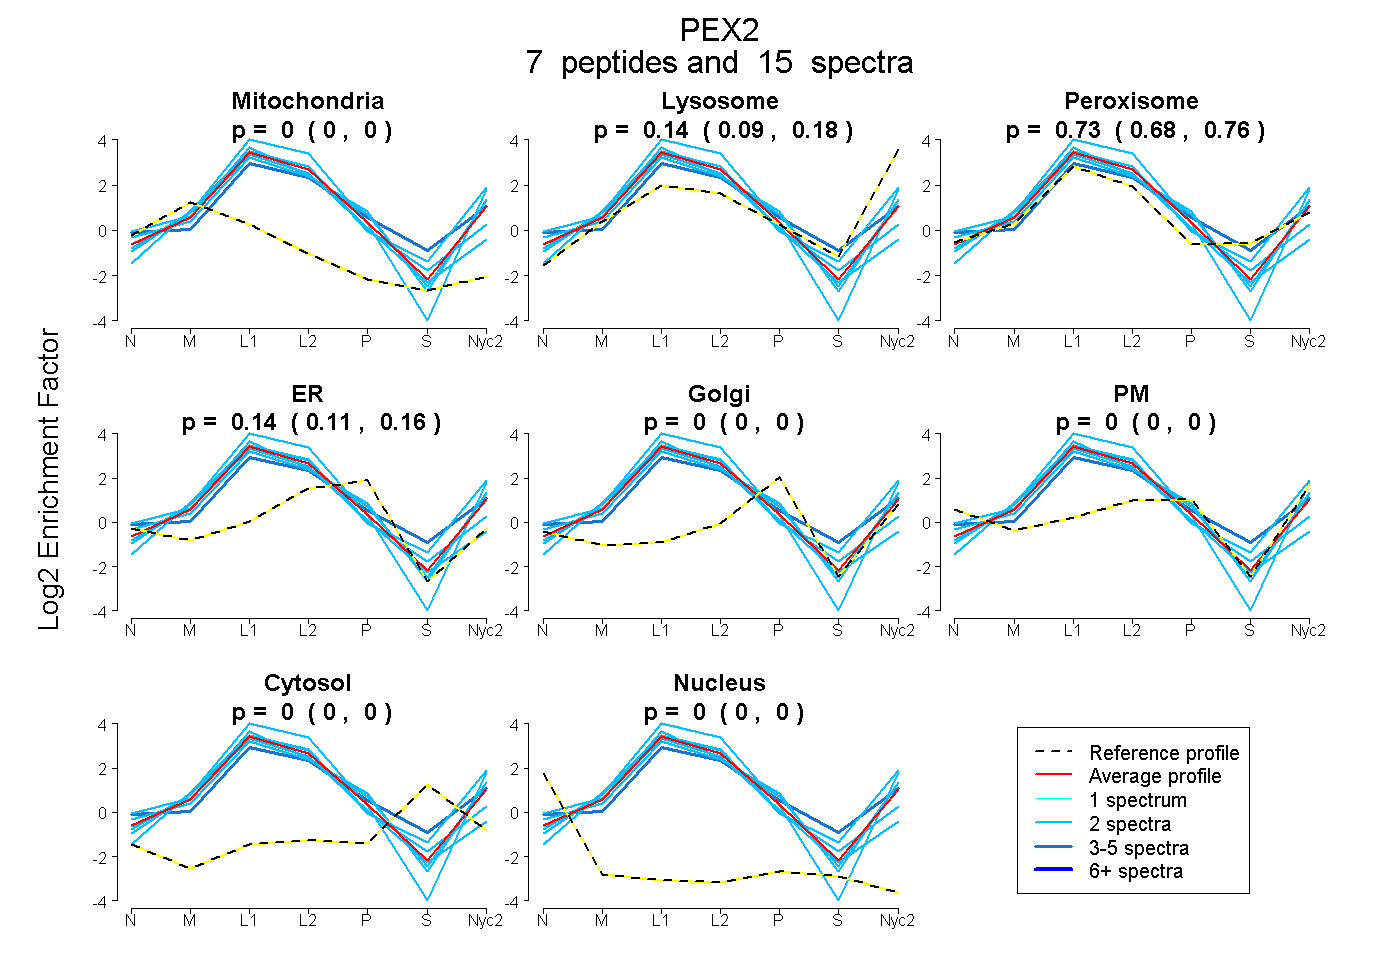
0.000 | 0.000
0.090 | 0.176
0.683 | 0.765
0.110 | 0.159
0.000 | 0.000
0.000 | 0.000
0.000 | 0.000
0.000 | 0.000
1peptide
spectra
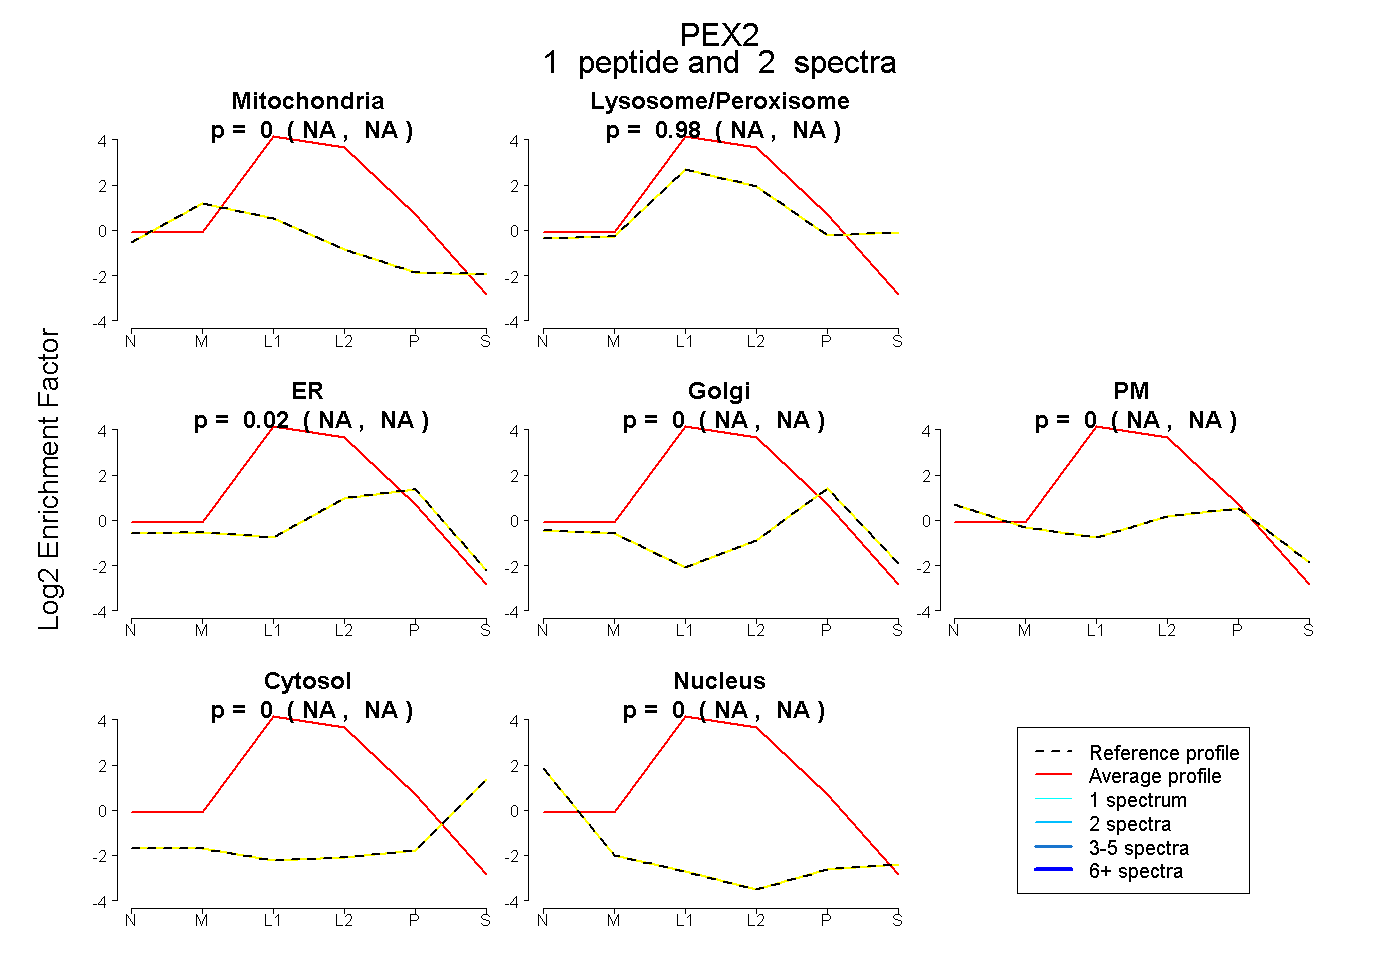
NA | NA
NA | NA
NA | NA
NA | NA
NA | NA
NA | NA
NA | NA
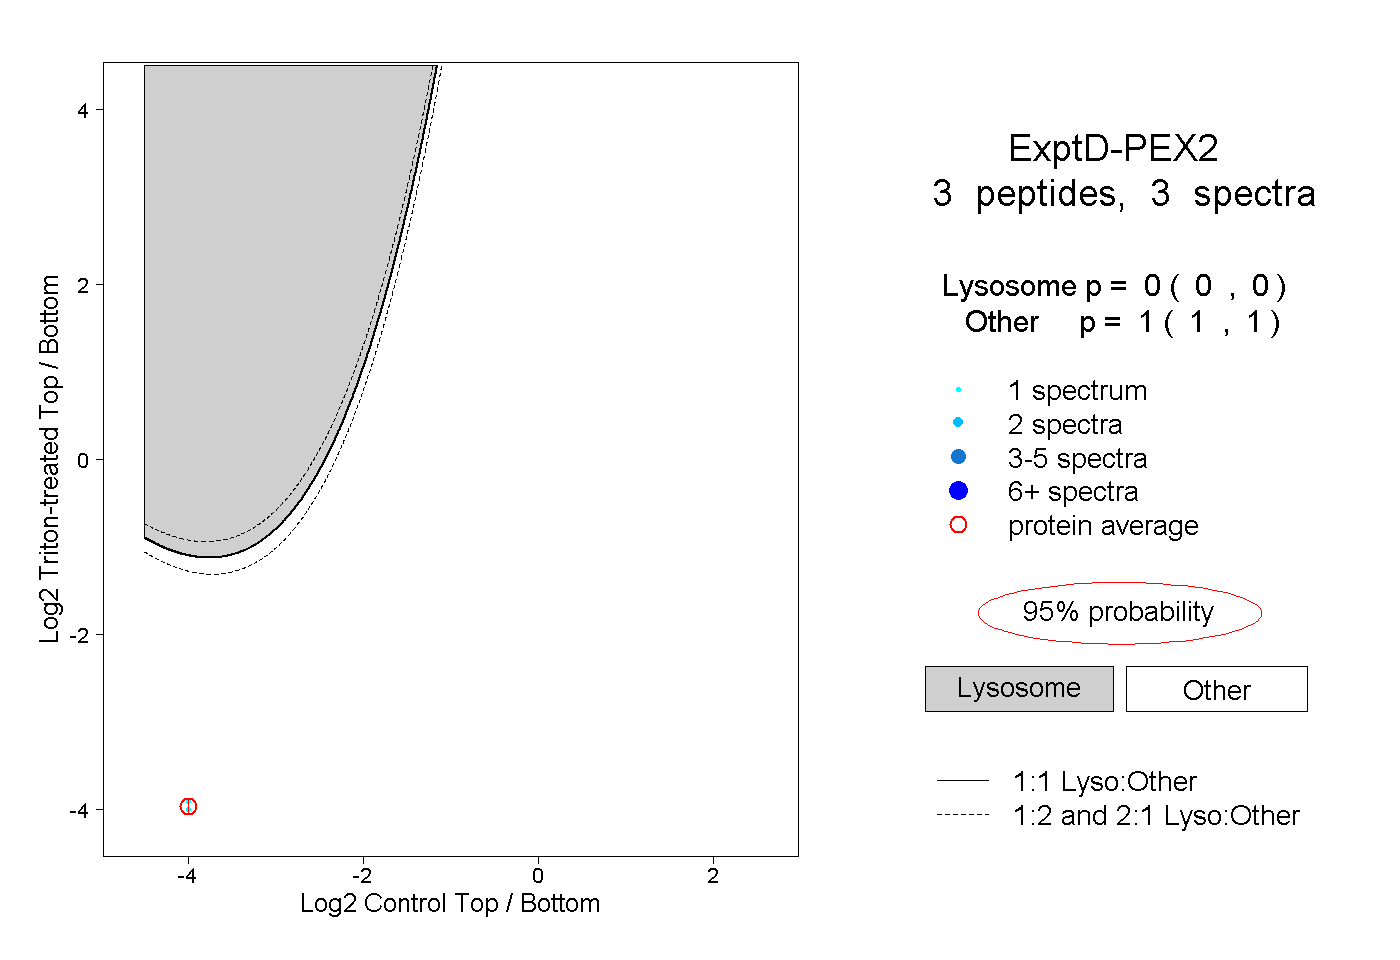
12peptides
spectra
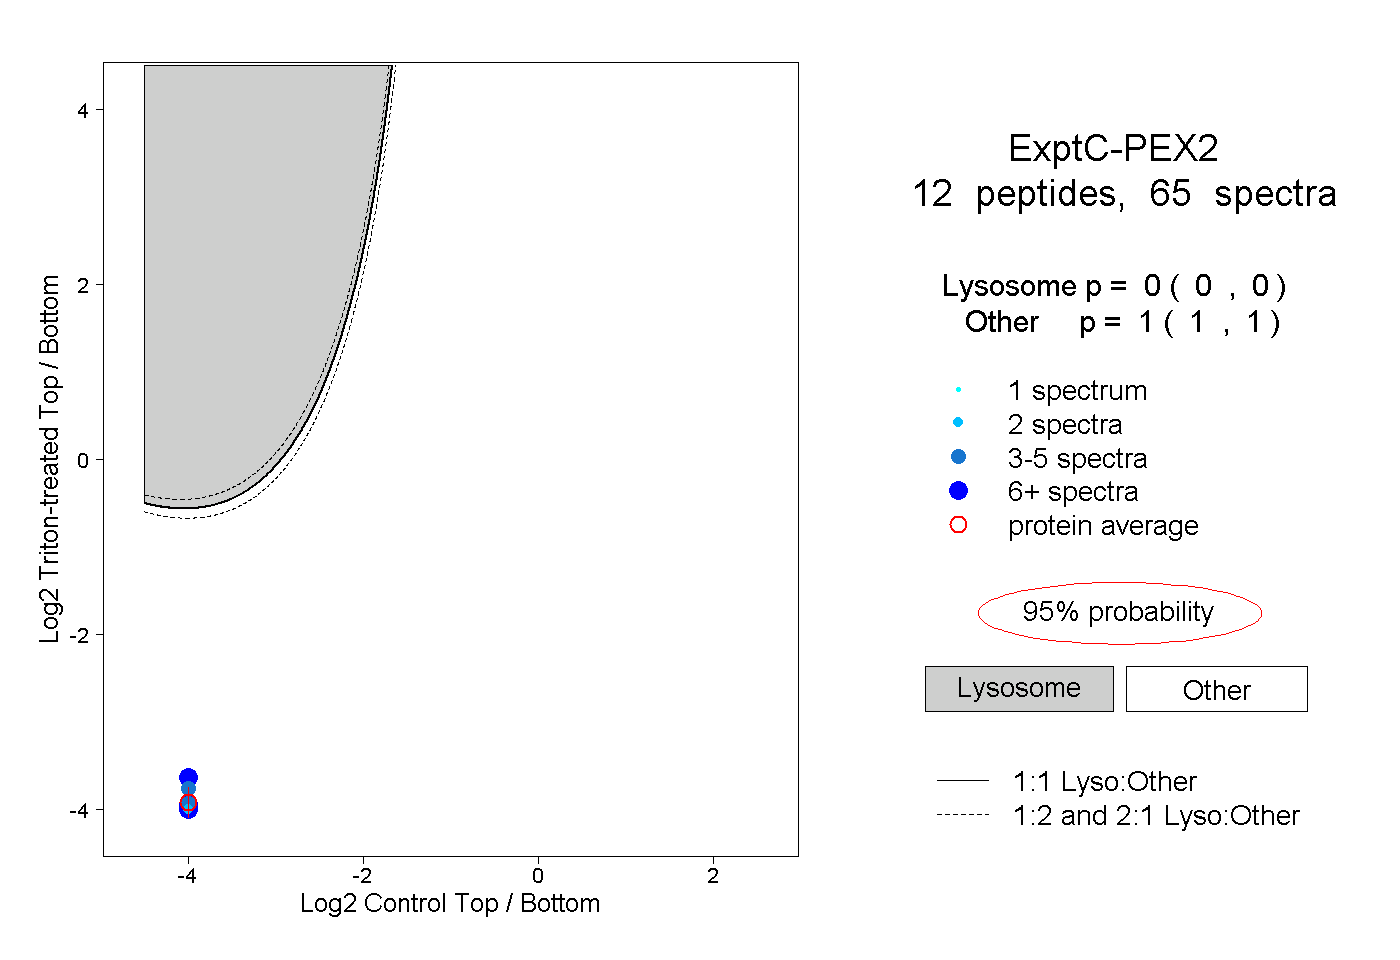
0.000 | 0.000
1.000 | 1.000