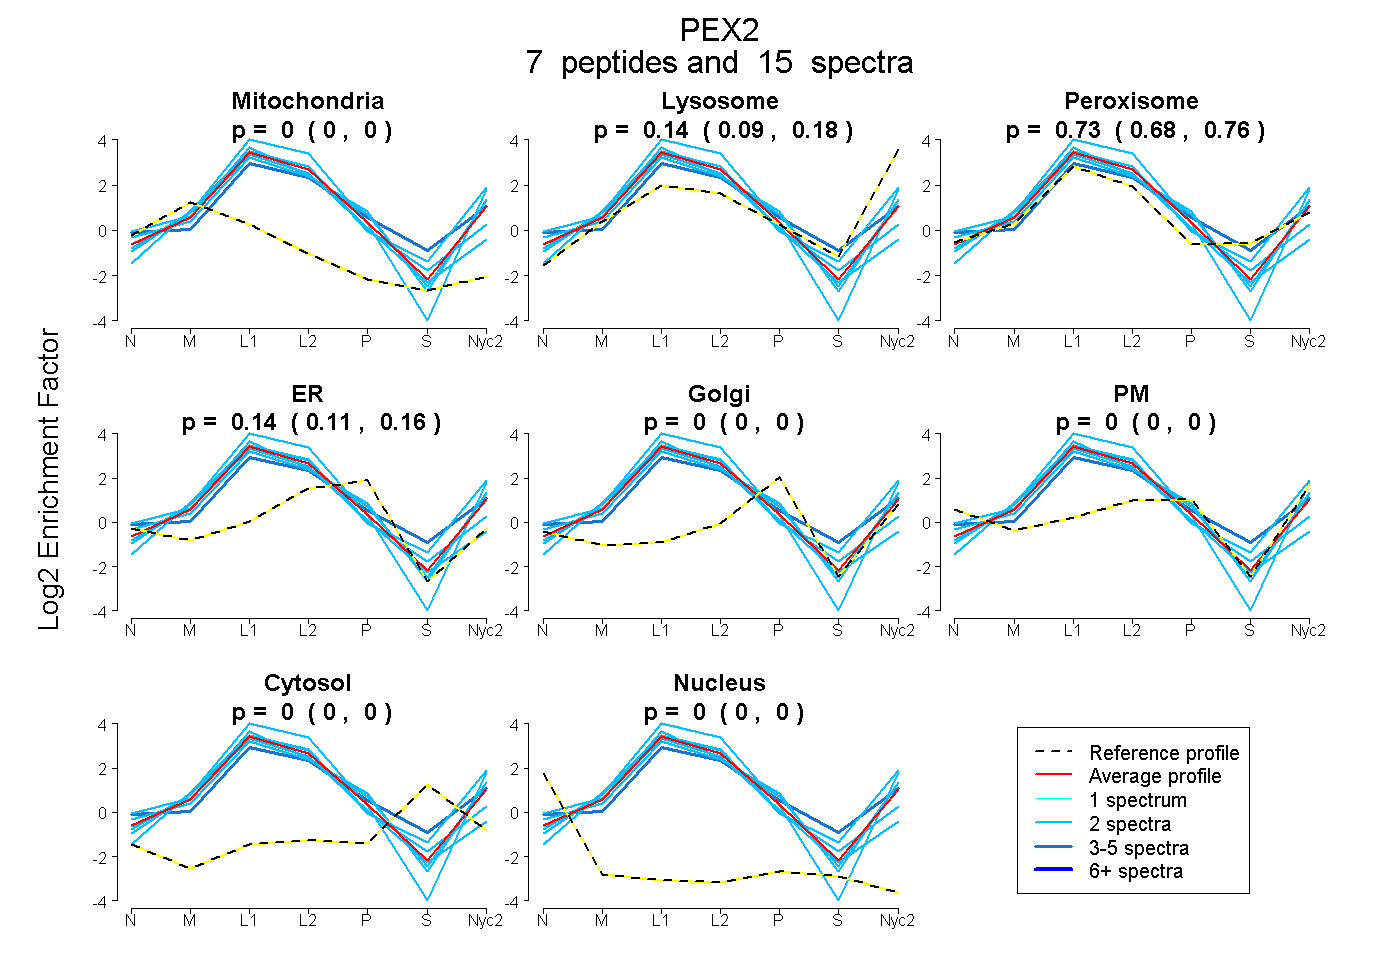
 7
7peptides
spectra
0.000 | 0.000
0.090 | 0.176
0.683 | 0.765
0.110 | 0.159
0.000 | 0.000
0.000 | 0.000
0.000 | 0.000
0.000 | 0.000
| Plot | Mito | Lyso | Perox | ER | Golgi | PM | Cytosol | Nucleus | |||||
| Expt A |
7 peptides |
15 spectra |
|
0.000 0.000 | 0.000 |
0.137 0.090 | 0.176 |
0.727 0.683 | 0.765 |
0.136 0.110 | 0.159 |
0.000 0.000 | 0.000 |
0.000 0.000 | 0.000 |
0.000 0.000 | 0.000 |
0.000 0.000 | 0.000 |
| 2 spectra, ISQLDALELNK | 0.000 | 0.254 | 0.483 | 0.262 | 0.000 | 0.000 | 0.000 | 0.000 | ||
| 2 spectra, EESTQSANR | 0.000 | 0.396 | 0.466 | 0.138 | 0.000 | 0.000 | 0.000 | 0.000 | ||
| 2 spectra, CYDLFR | 0.000 | 0.000 | 0.910 | 0.090 | 0.000 | 0.000 | 0.000 | 0.000 | ||
| 2 spectra, FATLTER | 0.000 | 0.391 | 0.609 | 0.000 | 0.000 | 0.000 | 0.000 | 0.000 | ||
| 2 spectra, EVGFEYMNR | 0.000 | 0.245 | 0.602 | 0.153 | 0.000 | 0.000 | 0.000 | 0.000 | ||
| 3 spectra, CGTEVHSVQPLK | 0.000 | 0.085 | 0.774 | 0.141 | 0.000 | 0.000 | 0.000 | 0.000 | ||
| 2 spectra, LLYAVCTIGGR | 0.037 | 0.000 | 0.762 | 0.201 | 0.000 | 0.000 | 0.000 | 0.000 |
| Plot | Mito | Lyso or Perox | ER | Golgi | PM | Cytosol | Nucleus | ||||||
| Expt B |
1 peptide |
2 spectra |
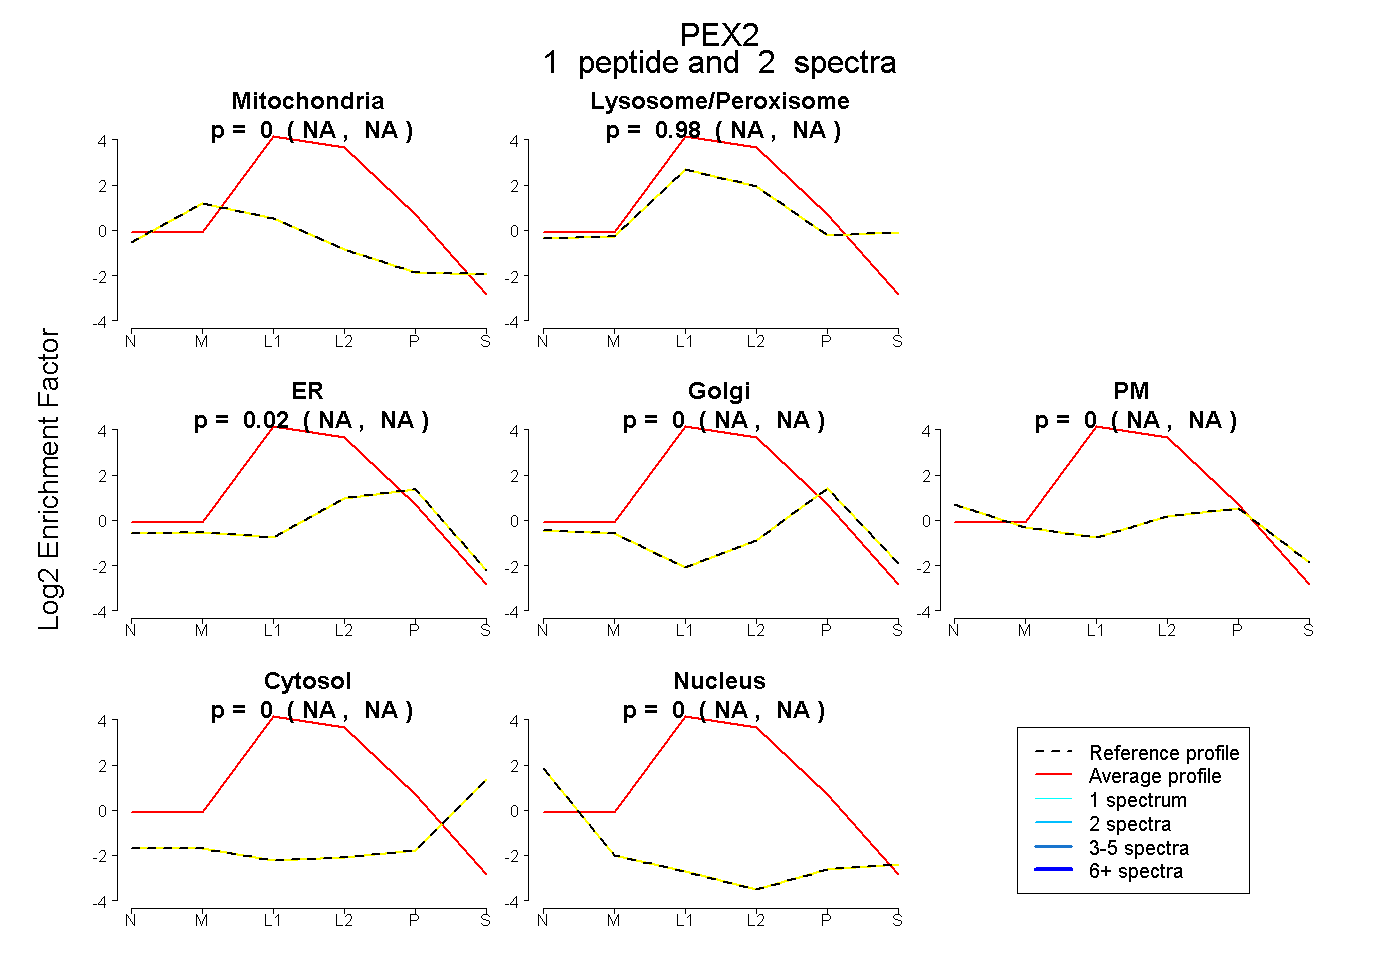 |
0.000 NA | NA |
0.981 NA | NA |
0.019 NA | NA |
0.000 NA | NA |
0.000 NA | NA |
0.000 NA | NA |
0.000 NA | NA |
|||
| Plot | Lyso | Other | |||||||||||
| Expt C |
12 peptides |
65 spectra |
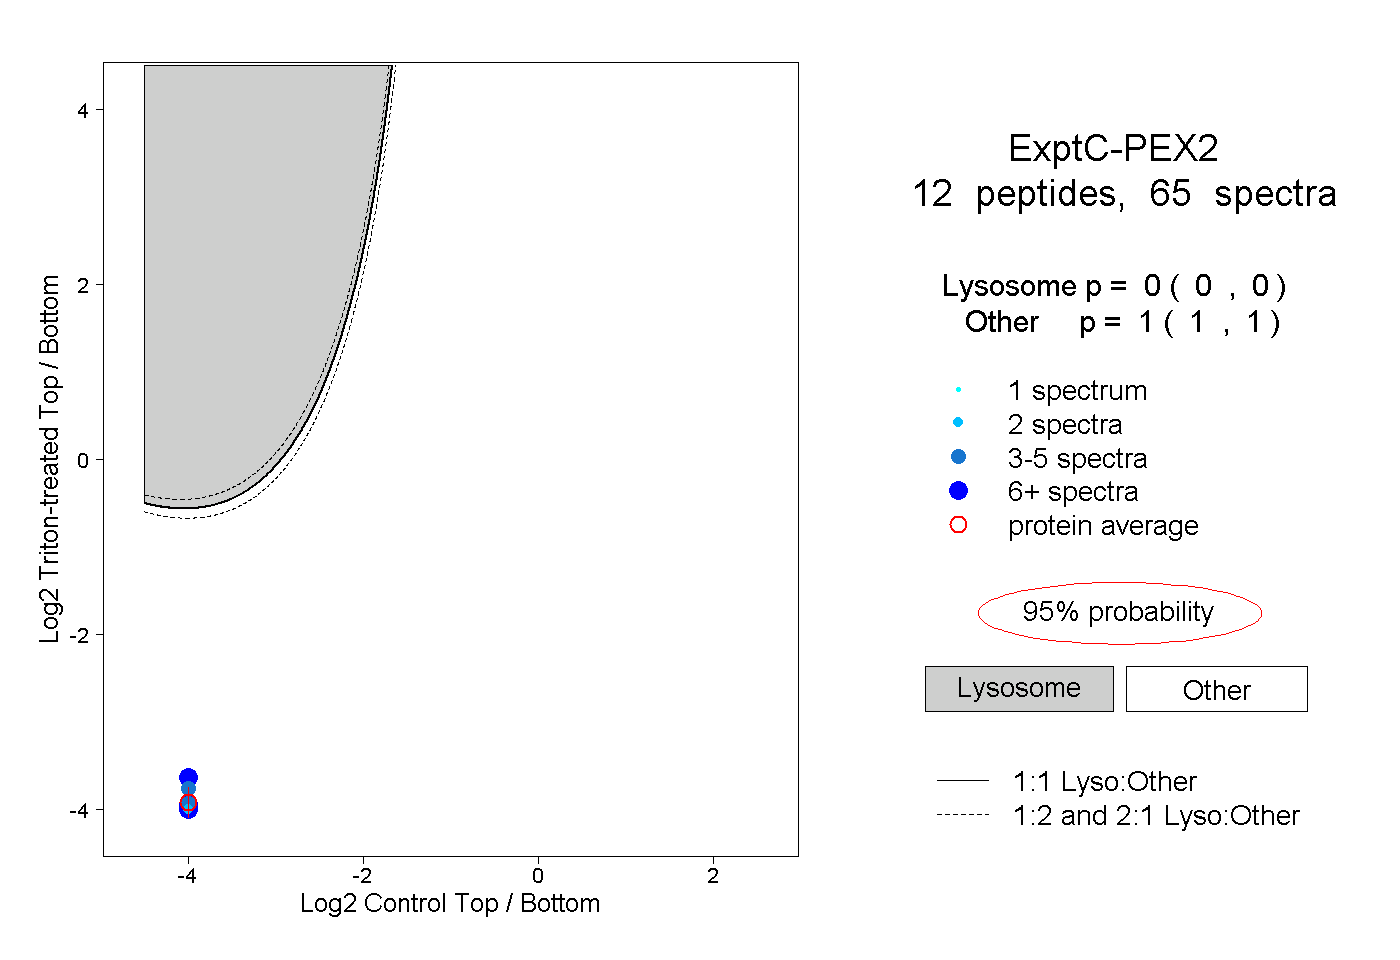 |
0.000 0.000 | 0.000 |
1.000 1.000 | 1.000 |
||||||||
| Plot | Lyso | Other | |||||||||||
| Expt D |
3 peptides |
3 spectra |
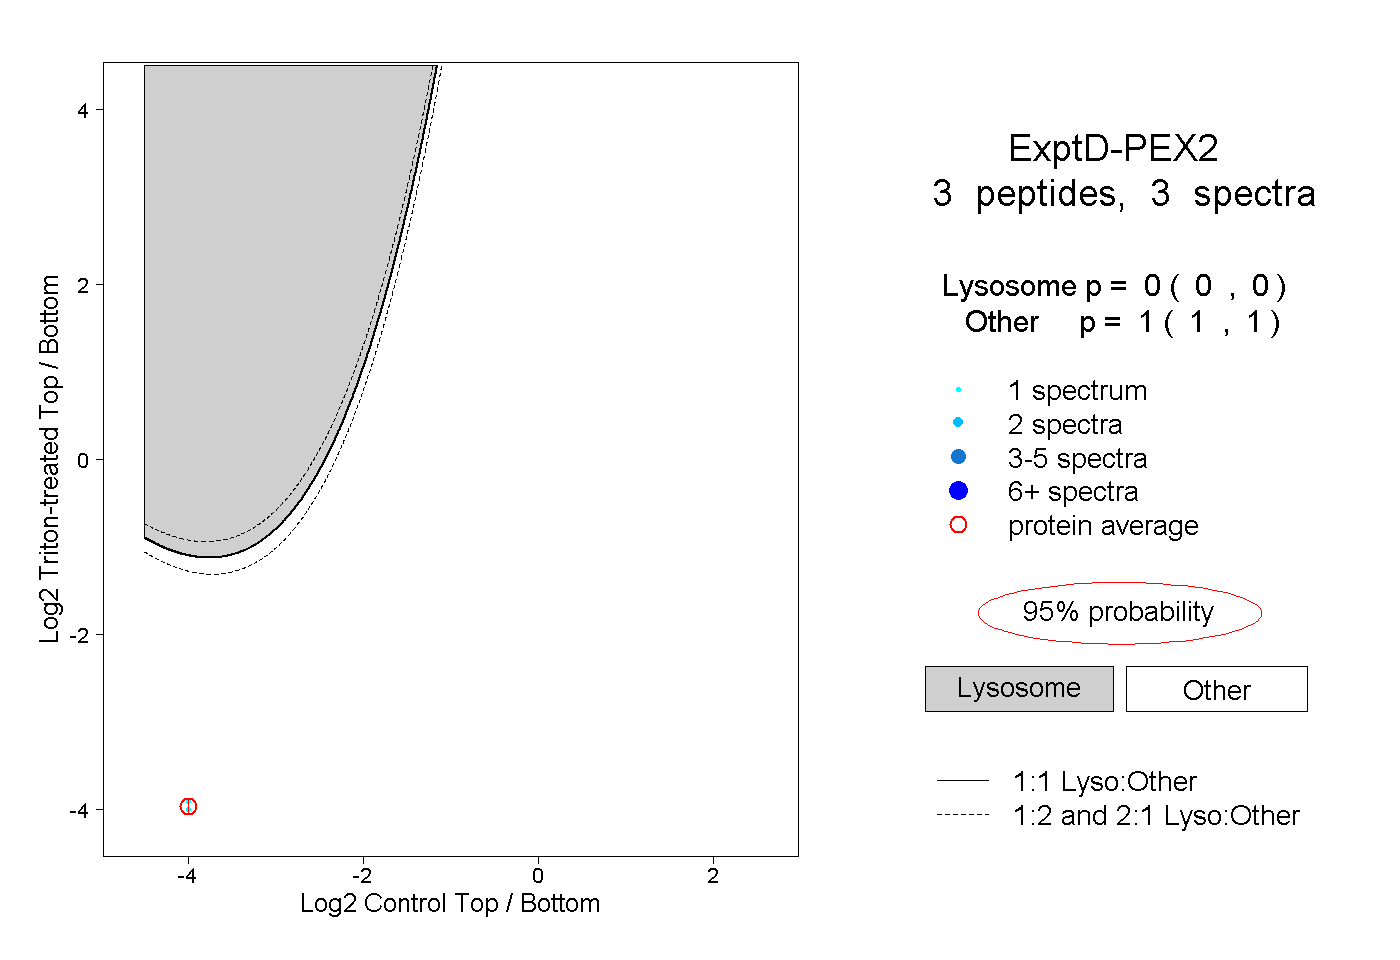 |
0.000 0.000 | 0.000 |
1.000 1.000 | 1.000 |