 3
3peptides
spectra
0.000 | 0.000
0.007 | 0.181
0.000 | 0.022
0.000 | 0.055
0.395 | 0.623
0.000 | 0.085
0.275 | 0.380
0.000 | 0.000
2peptides
spectra
NA | NA
NA | NA
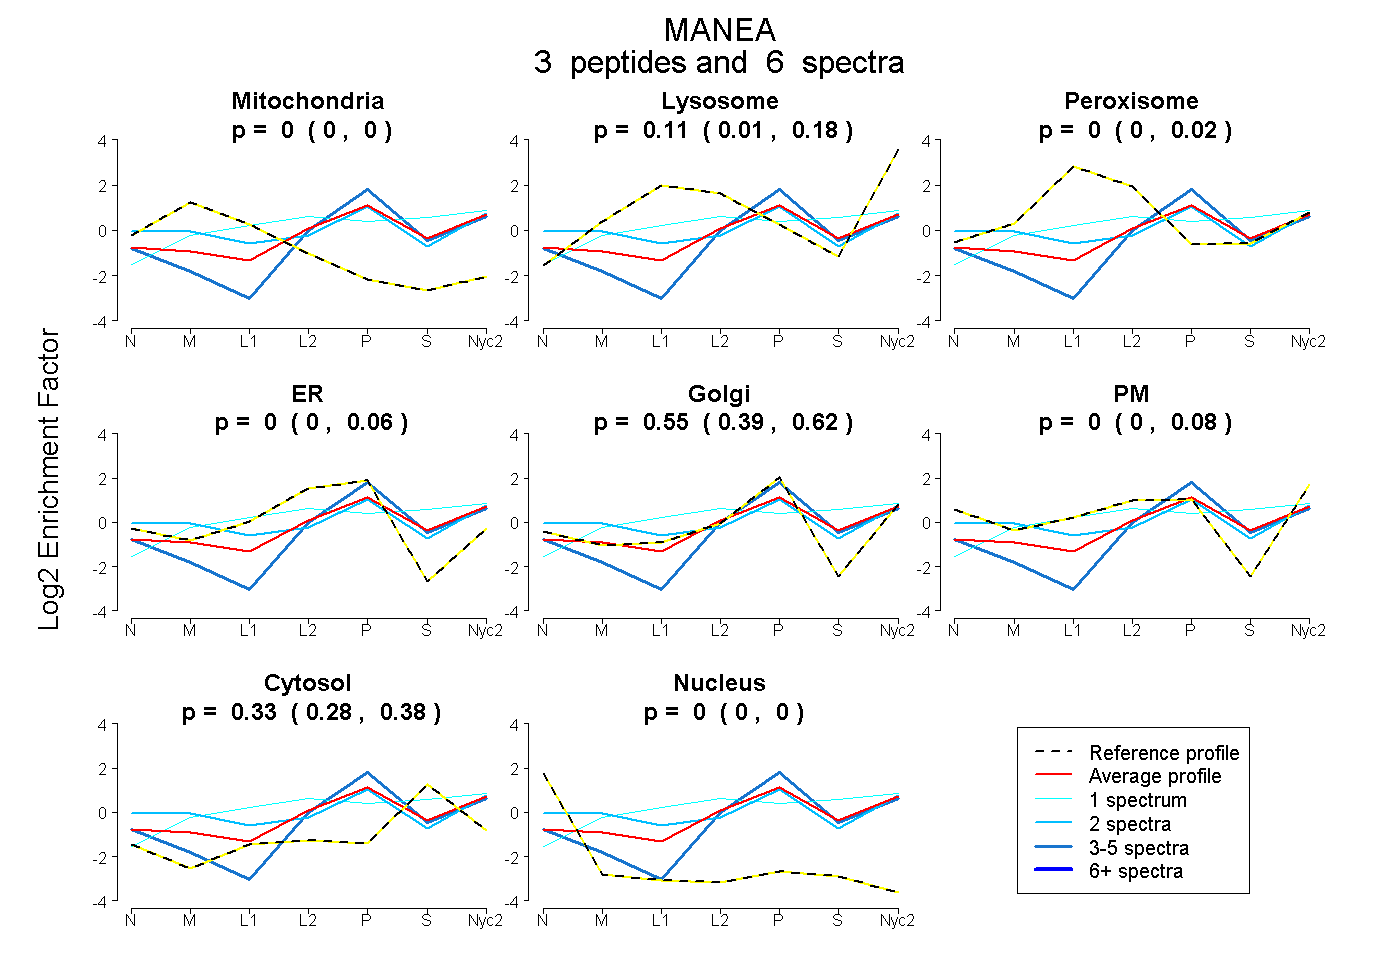
| Plot | Mito | Lyso | Perox | ER | Golgi | PM | Cytosol | Nucleus | |||||
| Expt A |
3 peptides |
6 spectra |
|
0.000 0.000 | 0.000 |
0.114 0.007 | 0.181 |
0.000 0.000 | 0.022 |
0.000 0.000 | 0.055 |
0.552 0.395 | 0.623 |
0.000 0.000 | 0.085 |
0.334 0.275 | 0.380 |
0.000 0.000 | 0.000 |
||
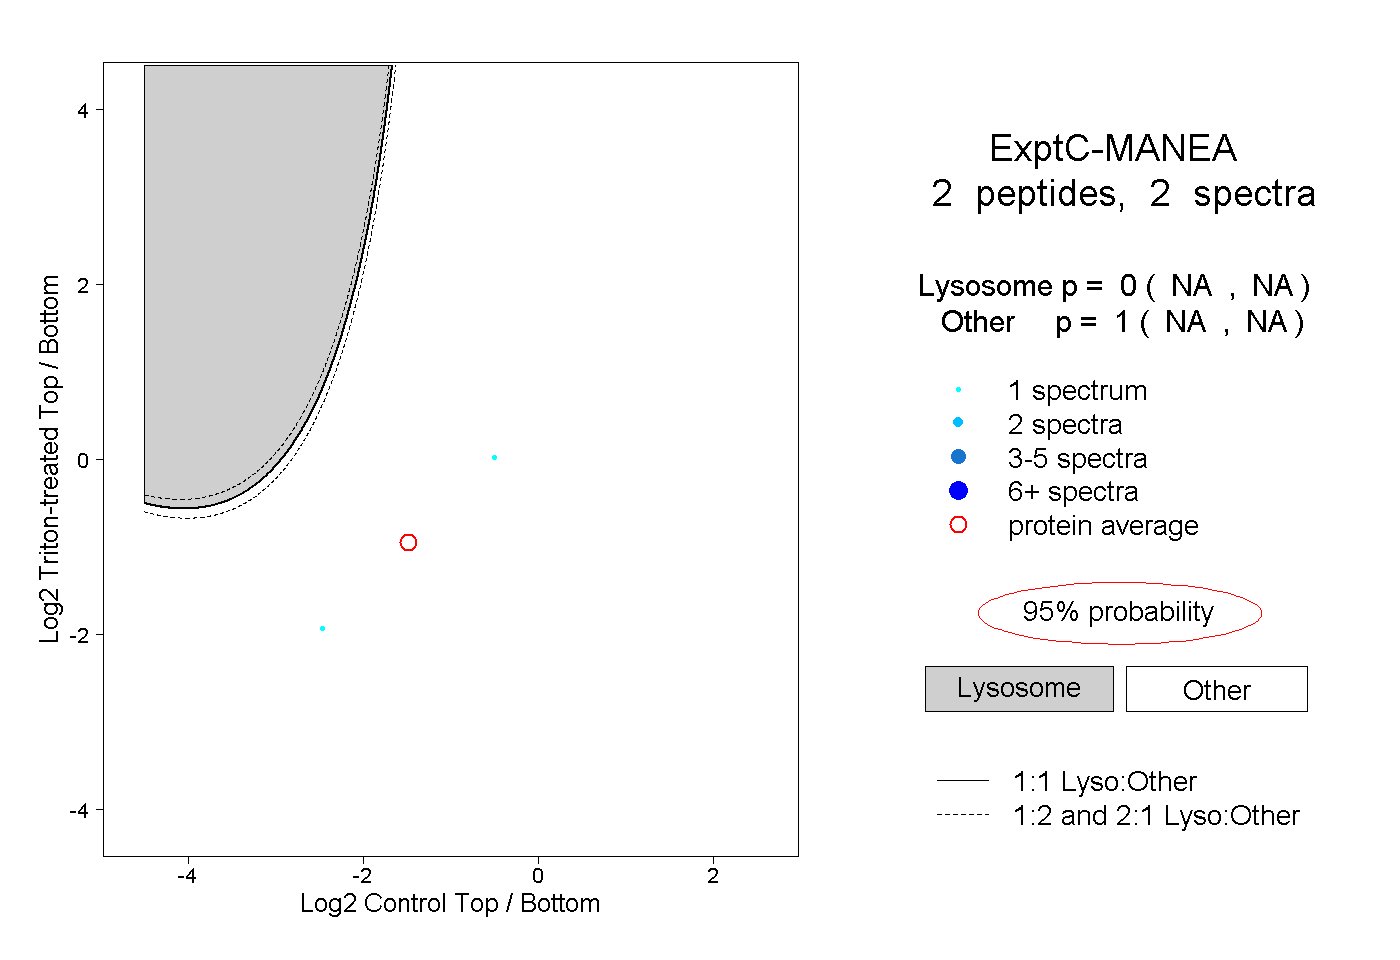
| Plot | Lyso | Other | |||||||||||
| Expt C |
2 peptides |
2 spectra |
|
0.000 NA | NA |
1.000 NA | NA |