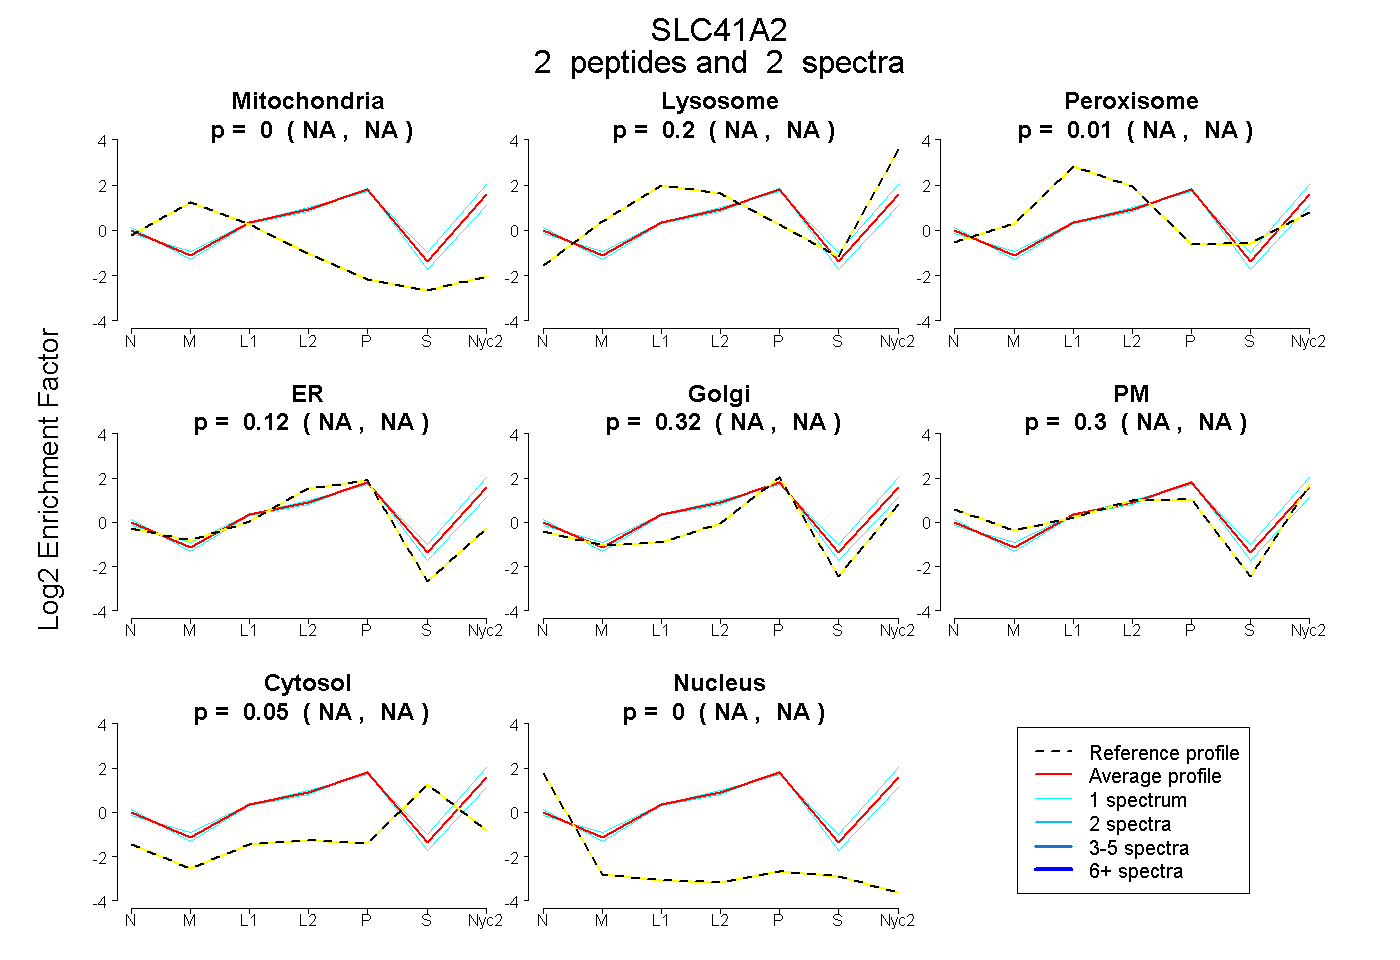
 2
2peptides
spectra
NA | NA
NA | NA
NA | NA
NA | NA
NA | NA
NA | NA
NA | NA
NA | NA
| Plot | Mito | Lyso | Perox | ER | Golgi | PM | Cytosol | Nucleus | |||||
| Expt A |
2 peptides |
2 spectra |
|
0.000 NA | NA |
0.198 NA | NA |
0.007 NA | NA |
0.123 NA | NA |
0.323 NA | NA |
0.296 NA | NA |
0.053 NA | NA |
0.000 NA | NA |
| 1 spectrum, YDDYAGYNYCDGR | 0.000 | 0.021 | 0.110 | 0.148 | 0.432 | 0.275 | 0.014 | 0.000 | ||
| 1 spectrum, GNLEMTLASR | 0.000 | 0.321 | 0.000 | 0.001 | 0.354 | 0.264 | 0.059 | 0.000 |
| Plot | Lyso | Other | |||||||||||
| Expt C |
2 peptides |
3 spectra |
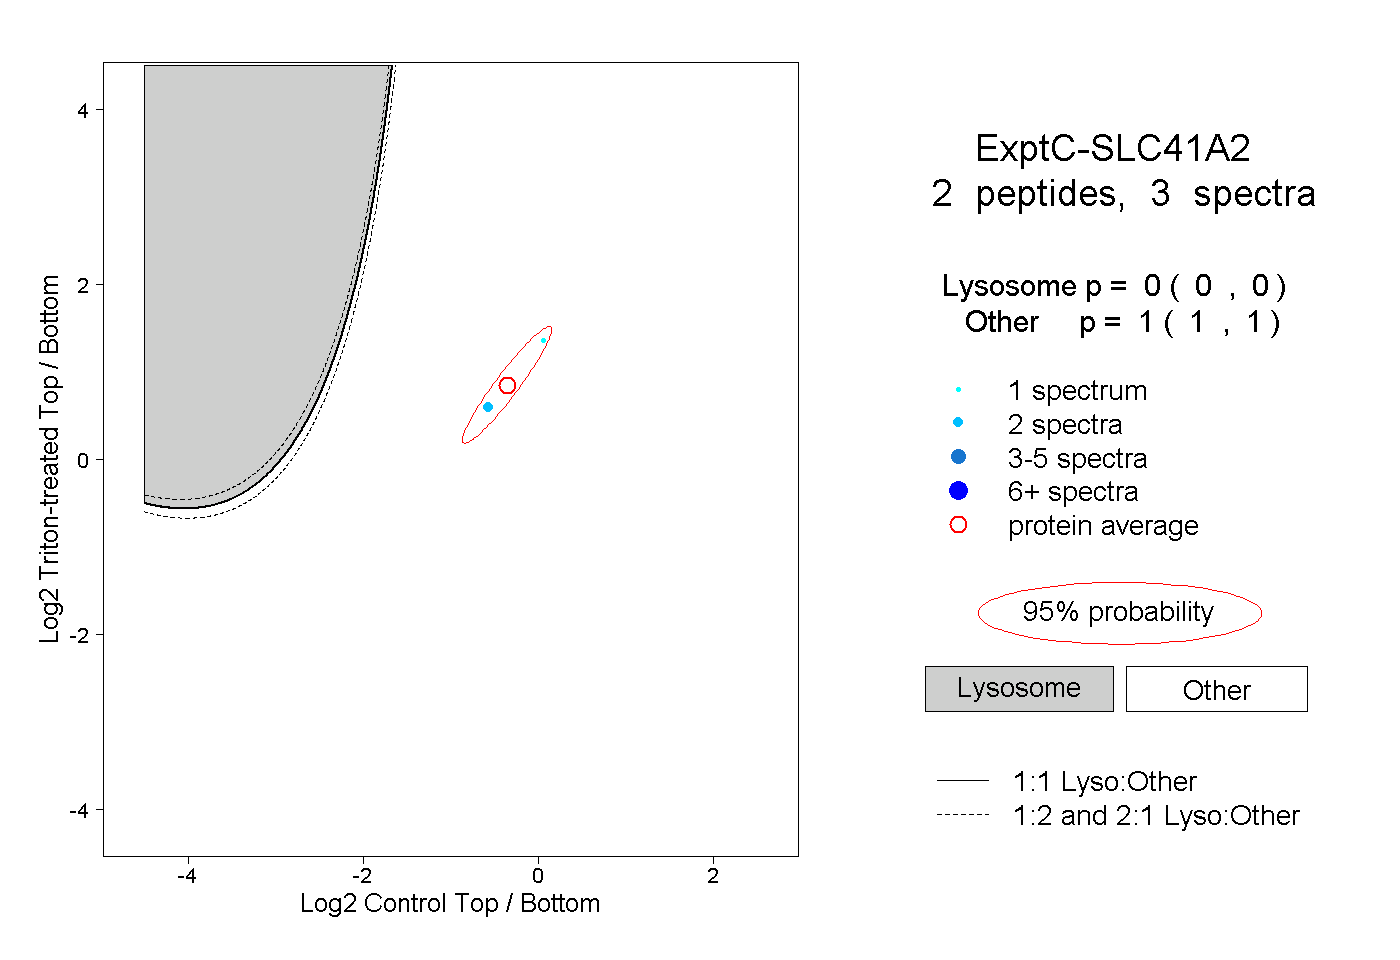 |
0.000 0.000 | 0.000 |
1.000 1.000 | 1.000 |