 4
4peptides
spectra
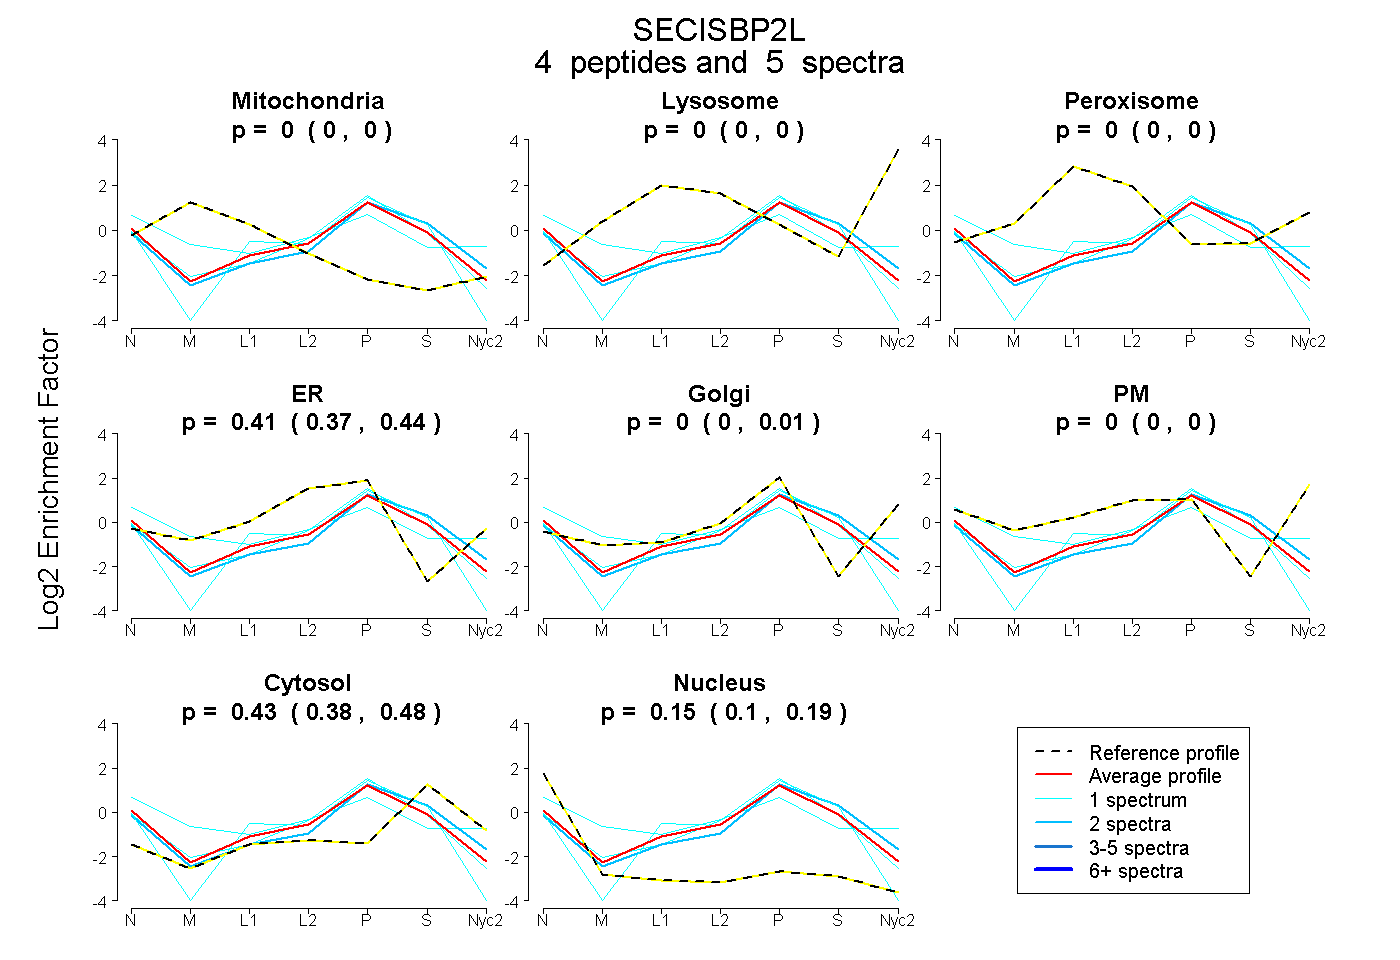
0.000 | 0.000
0.000 | 0.000
0.000 | 0.000
0.365 | 0.444
0.000 | 0.014
0.000 | 0.000
0.382 | 0.478
0.104 | 0.192
| Plot | Mito | Lyso | Perox | ER | Golgi | PM | Cytosol | Nucleus | |||||
| Expt A |
4 peptides |
5 spectra |
|
0.000 0.000 | 0.000 |
0.000 0.000 | 0.000 |
0.000 0.000 | 0.000 |
0.412 0.365 | 0.444 |
0.000 0.000 | 0.014 |
0.000 0.000 | 0.000 |
0.434 0.382 | 0.478 |
0.153 0.104 | 0.192 |
| 2 spectra, LVELTEEAR | 0.000 | 0.000 | 0.000 | 0.197 | 0.167 | 0.000 | 0.533 | 0.102 | ||
| 1 spectrum, TPVQLDLGDMLAALEK | 0.000 | 0.000 | 0.000 | 0.306 | 0.000 | 0.000 | 0.470 | 0.224 | ||
| 1 spectrum, EQEIPFVFALGR | 0.000 | 0.000 | 0.000 | 0.443 | 0.000 | 0.000 | 0.400 | 0.157 | ||
| 1 spectrum, HNNQPAPGTLR | 0.056 | 0.000 | 0.000 | 0.225 | 0.122 | 0.216 | 0.266 | 0.115 |
| Plot | Lyso | Other | |||||||||||
| Expt C |
1 peptide |
1 spectrum |
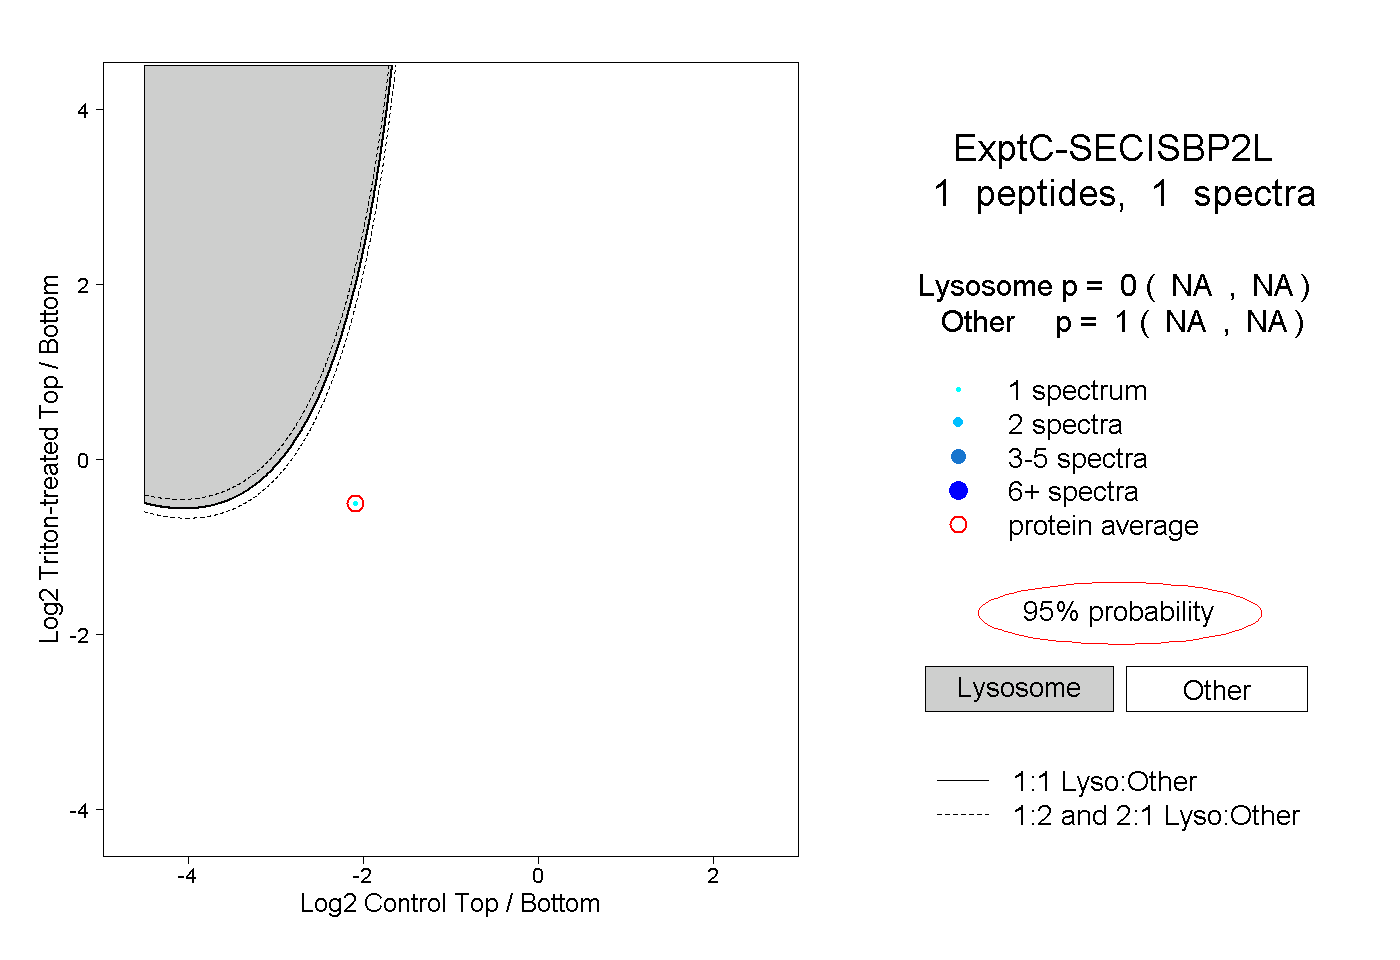 |
0.000 NA | NA |
1.000 NA | NA |