 23
23peptides
spectra
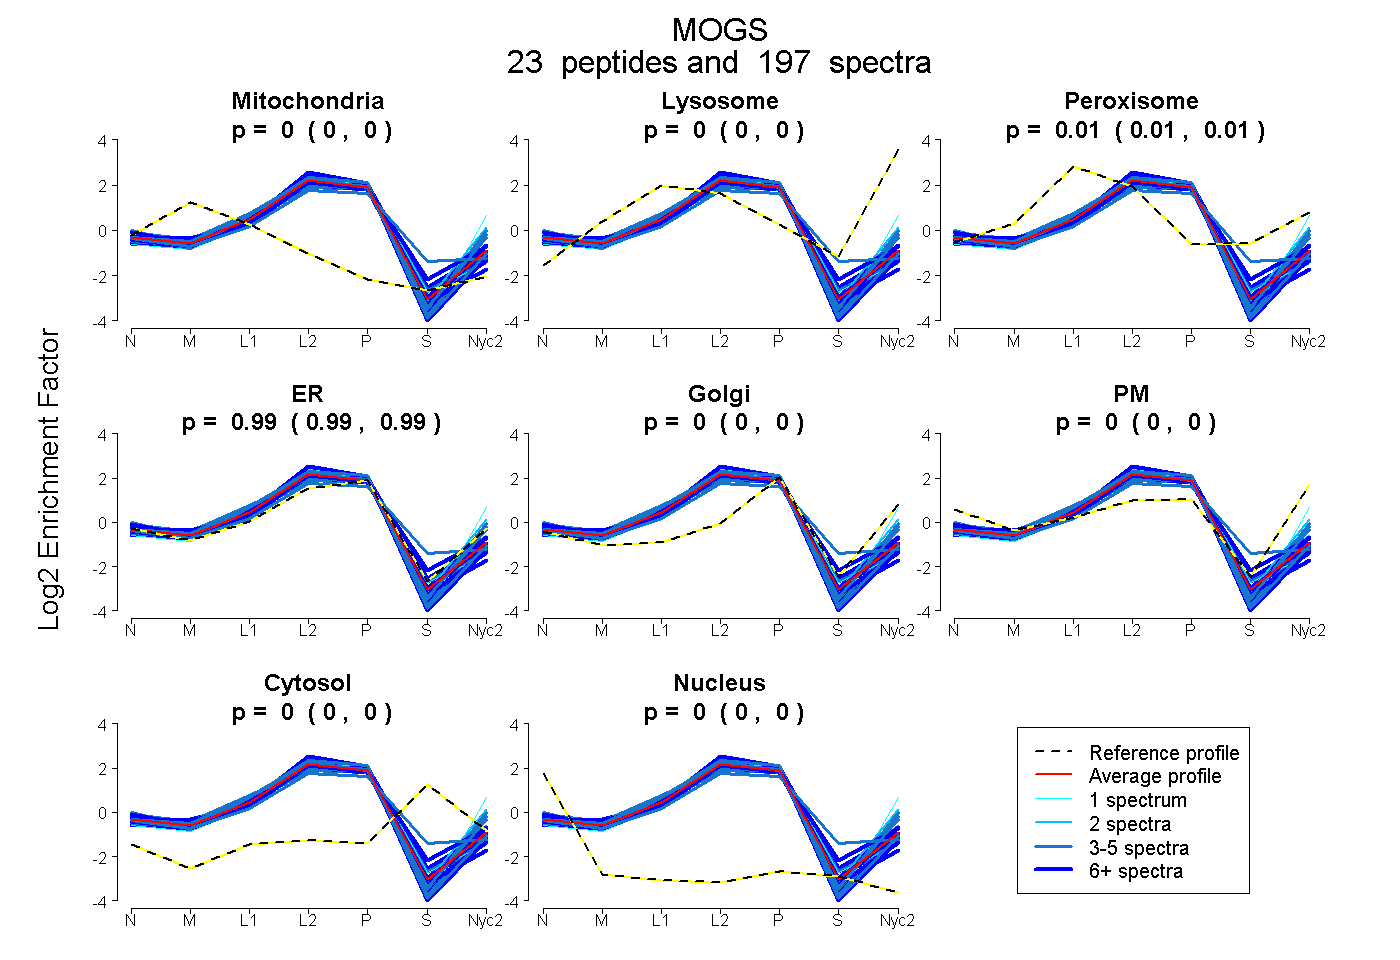
0.000 | 0.002
0.000 | 0.000
0.007 | 0.012
0.987 | 0.990
0.000 | 0.000
0.000 | 0.000
0.000 | 0.000
0.000 | 0.000
23peptides
spectra
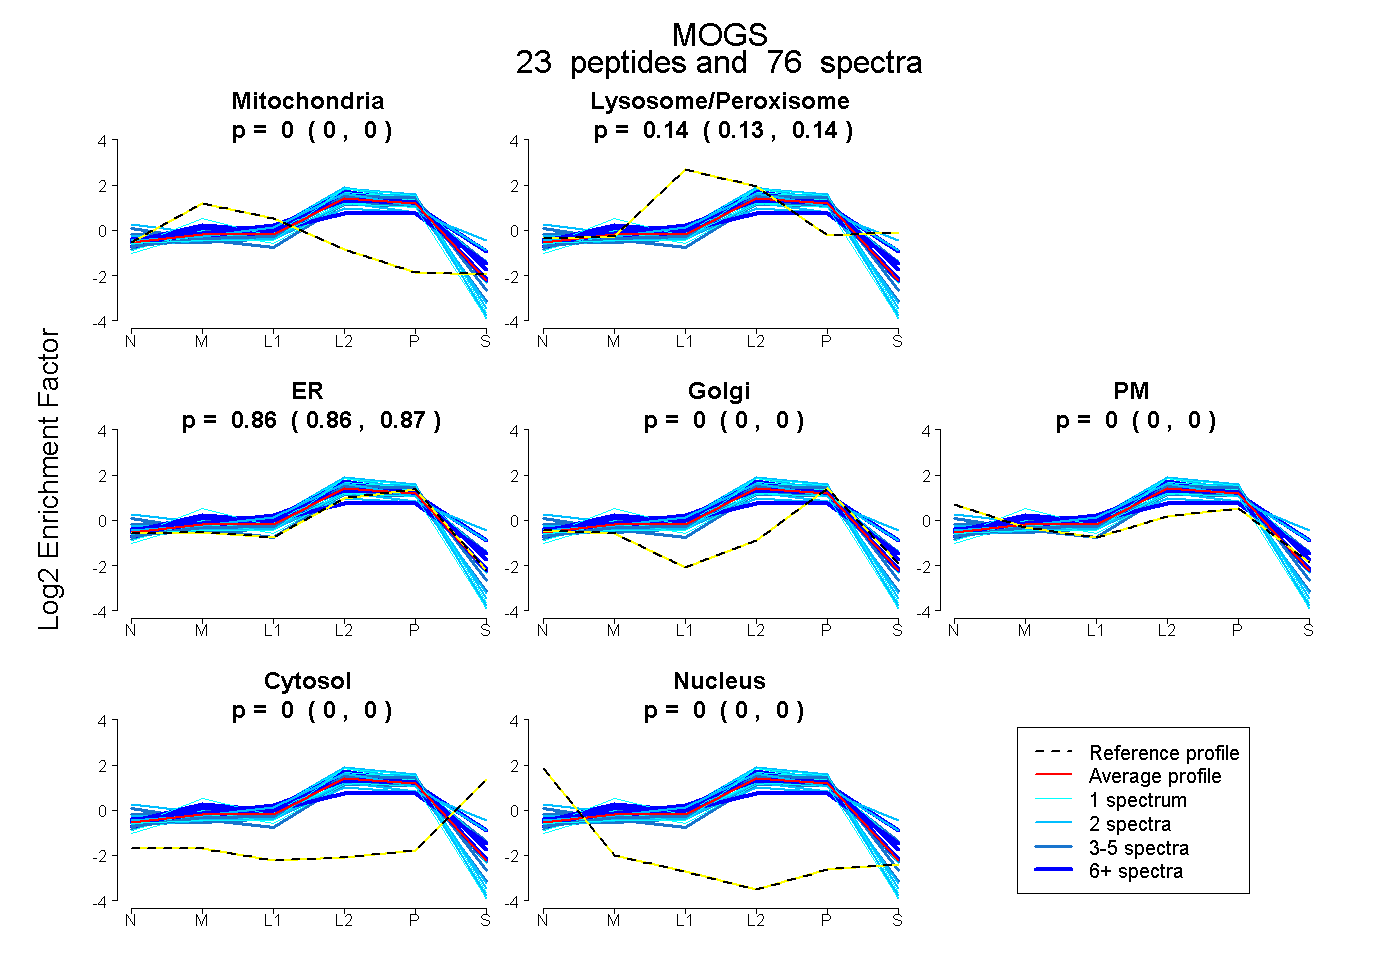
0.000 | 0.000
0.133 | 0.142
0.857 | 0.867
0.000 | 0.000
0.000 | 0.000
0.000 | 0.000
0.000 | 0.000
23peptides
spectra
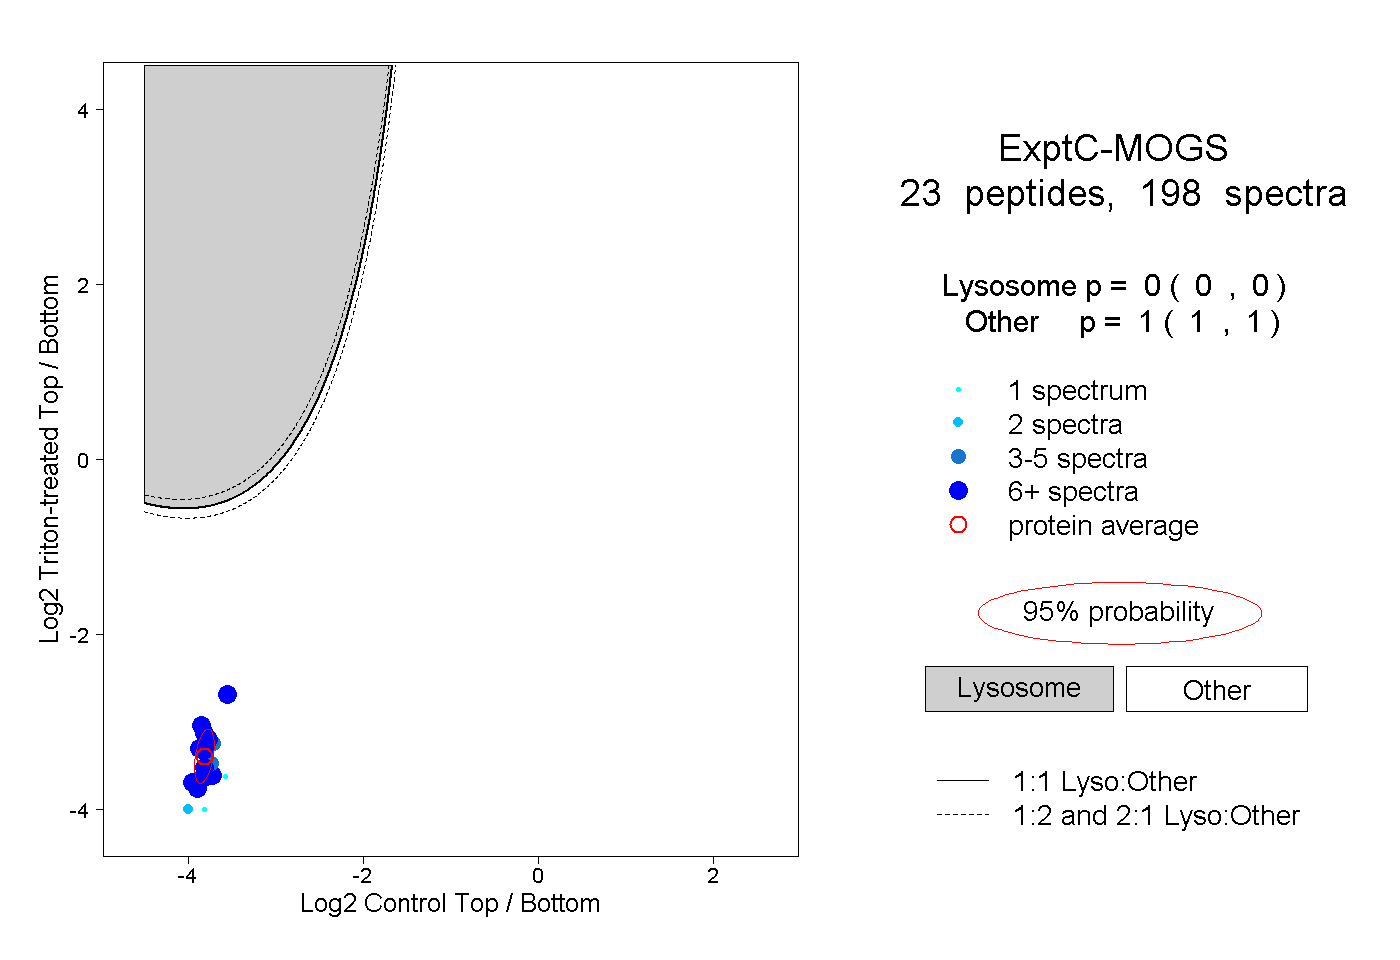
0.000 | 0.000
1.000 | 1.000
11peptides
spectra
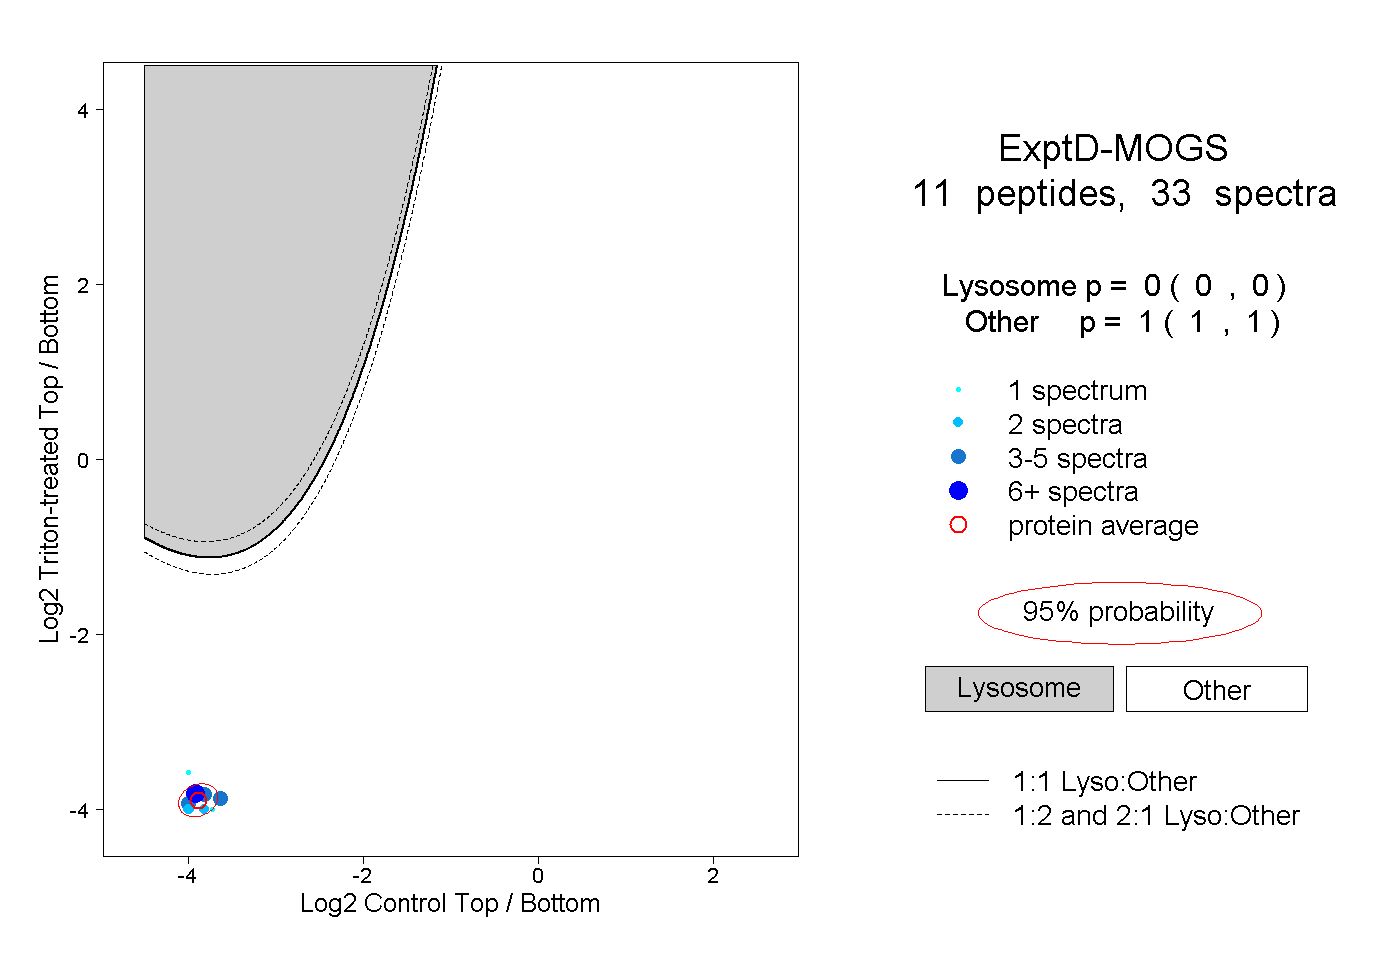
0.000 | 0.000
1.000 | 1.000